


TECHNICAL SUPPORT


Published 2026-01-19
You know that moment when things just start to drag? Not a crash, not a full stop, but a sluggishness that creeps in. Responses take a heartbeat too long. A process that used to be snappy now feels like it’s wading through mud. It’s the quiet groan of a system under strain, the kind of thing that doesn’t show up in a dramatic outage report, but chips away at everything else.

That’s the world of microservices performance. It’s rarely about one big, broken piece. It’s about a hundred small friction points—a misconfigured timeout here, an inefficient query there, a service chatty beyond belief—adding up until the whole flow feels off. So, how do you tune an orchestra when you can’t hear the individual instruments out of sync?
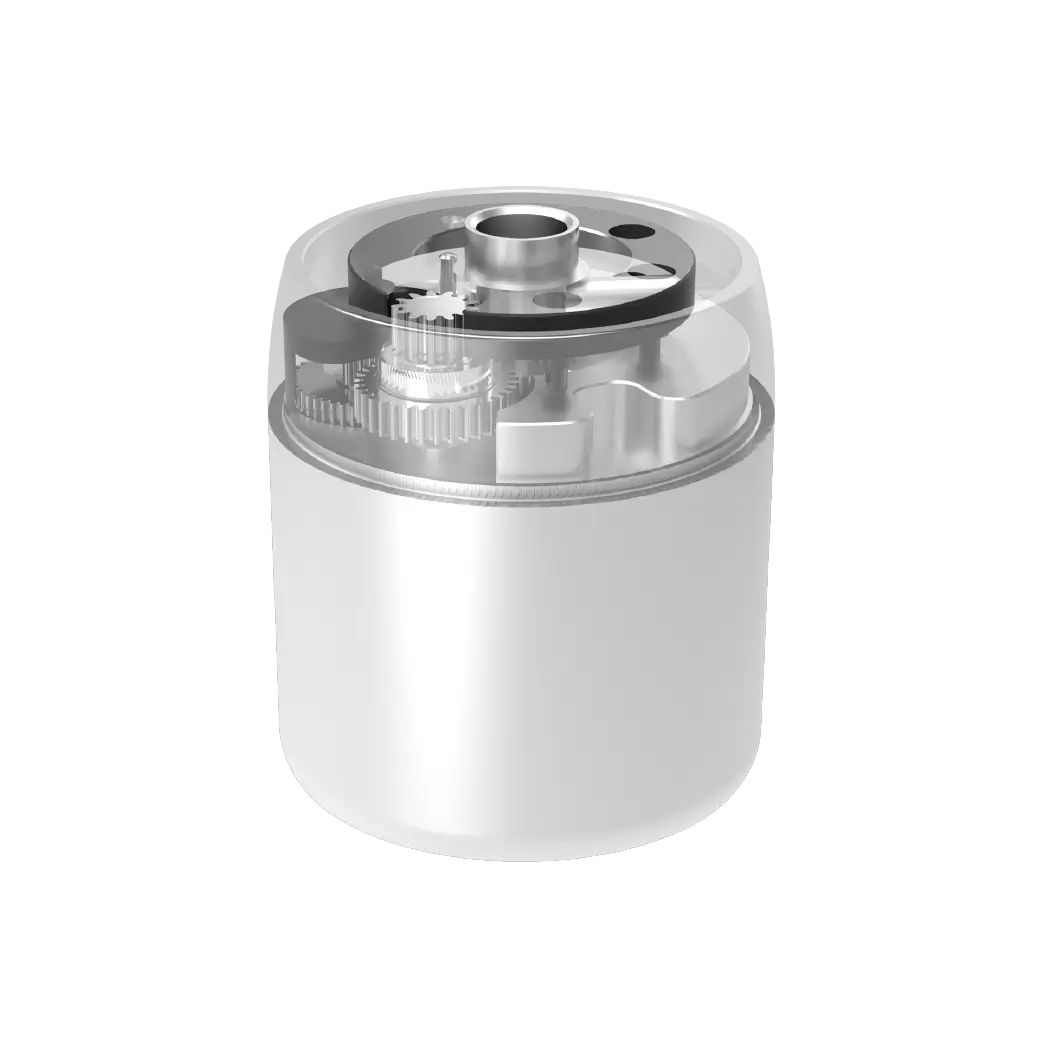
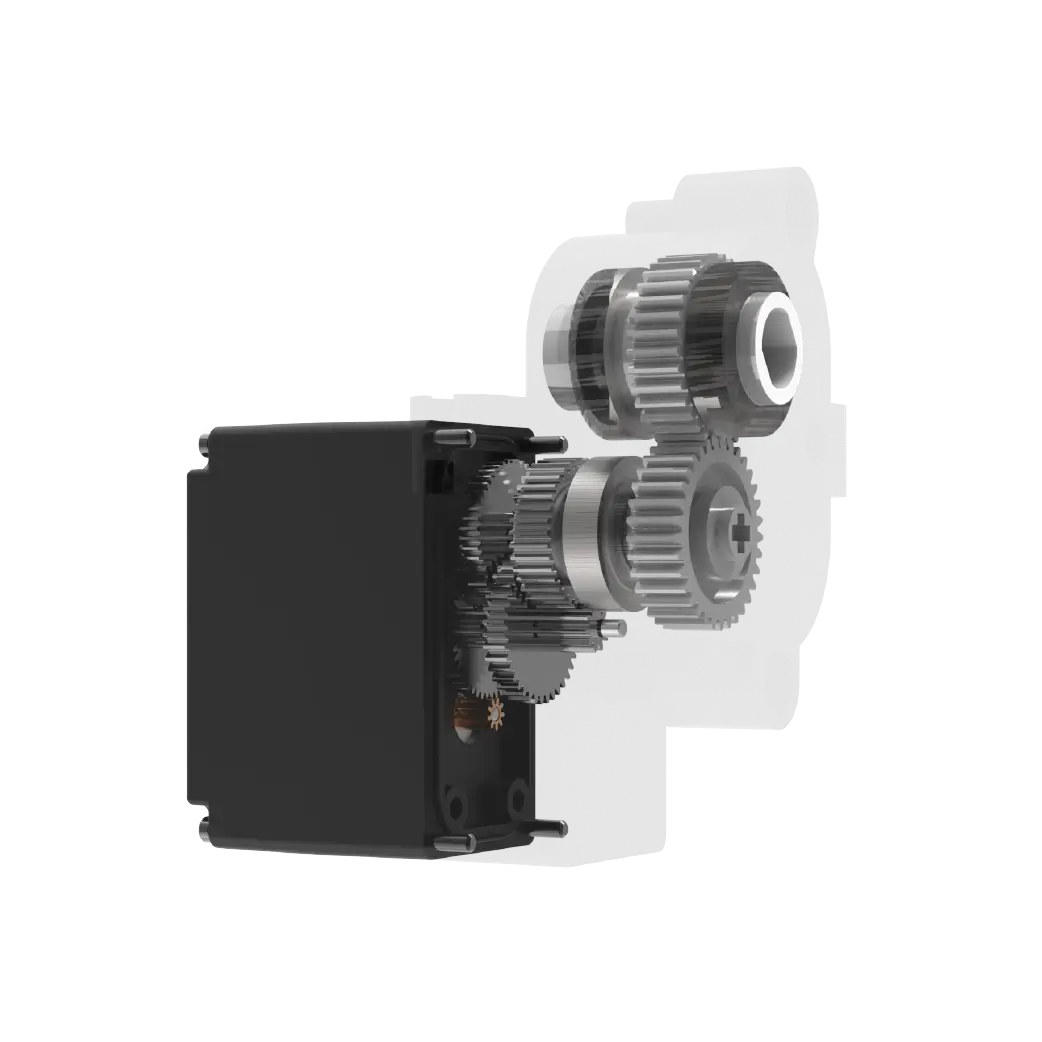
Think of it like a mechanical assembly line. Everyservomotor, every actuator, needs to move with precision and without delay. If one slows down even a fraction, the entire sequence falters. The product—your user experience—comes out flawed. The goal isn’t just to make each part faster in isolation; it’s to make them work together seamlessly, predicting each other’s moves, eliminating wasteful motion.
Where do you even start looking? The noise is everywhere.
Is it the network? Those tiny latencies between services, the serialization overhead—they pile up fast. Is it the data? A service might be fetching ten times what it needs, or querying in a loop, drowning itself and its database. Is it the design? Maybe services are too chatty, stuck in synchronous calls, waiting on each other like cars at a four-way stop with no traffic lights. Or is it something invisible? A memory leak growing slowly, a thread pool exhausted under a new load pattern.
You see the symptoms: 95th percentile latency spikes, throughput plateauing, resource usage climbing without a clear reason. But pointing to the exact “why” is like finding a specific loose bolt in a moving engine by sound alone.
This is where the approach shifts. It’s not about guessing. It’s about turning the invisible into something you can see and touch. Imagine having a detailed schematic for your entire distributed system, not just of the static structure, but of the live current flowing through it. You’d see the hot spots, the bottlenecks, the unused paths.
That’s what focused performance improvement feels like. It moves you from reactive firefighting to proactive tuning. You begin to answer questions you couldn’t even ask before:
The benefits aren’t just technical metrics on a dashboard. They translate. Faster, more reliable systems mean happier users—they get what they need without that subconscious wait. It means resilience; when one part has a hiccup, the rest can adapt instead of cascading into failure. Perhaps most importantly, it gives your team clarity. Development becomes less about avoiding unknown pitfalls and more about confident building. Operations spends less time in war rooms and more time on improvement.
So, what does doing it well look like? It’s a rhythm, not a one-time project.
First, you establish the baseline. You can’t improve what you don’t measure. Capture the “normal” state under typical load—latencies, error rates, resource consumption. This is your before picture.
Next, you instrument thoroughly. This goes beyond basic health checks. It’s about tracing a single request’s journey across every service boundary, logging meaningful performance data at each step. Distributed tracing is your best friend here.
Then, you analyze the data, not the logs. Look for patterns. Find the longest, widest traces. Identify the common ancestors in slow requests. Is there a specific service that, when it slows, drags down five others? That’s your leverage point.
Now, you prioritize and hypothesize. Not every bottleneck is worth fixing. Target the ones impacting critical user journeys or consuming disproportionate resources. Form a simple hypothesis: “If we optimize this database query, we expect the checkout latency to drop by X%.”
Implement, measure, and learn. Make the change, but do it surgically. Then compare against your baseline. Did it work? Did it have unintended side effects? This cycle of change and verification is core.
Finally, make it continuous. Performance isn’t a destination; it’s a constant part of the journey. Integrate performance gates into your deployment pipeline. Set alerts on degradation, not just outages. Foster a culture where asking “what is the performance impact?” is standard.
It’s a different way of thinking. Less about heroics, more about consistent, informed adjustment. Less about hoping for the best, more about knowing how the system will behave. And when it clicks, the whole machine just runs smoother—quietly, reliably, and ready for whatever comes next.
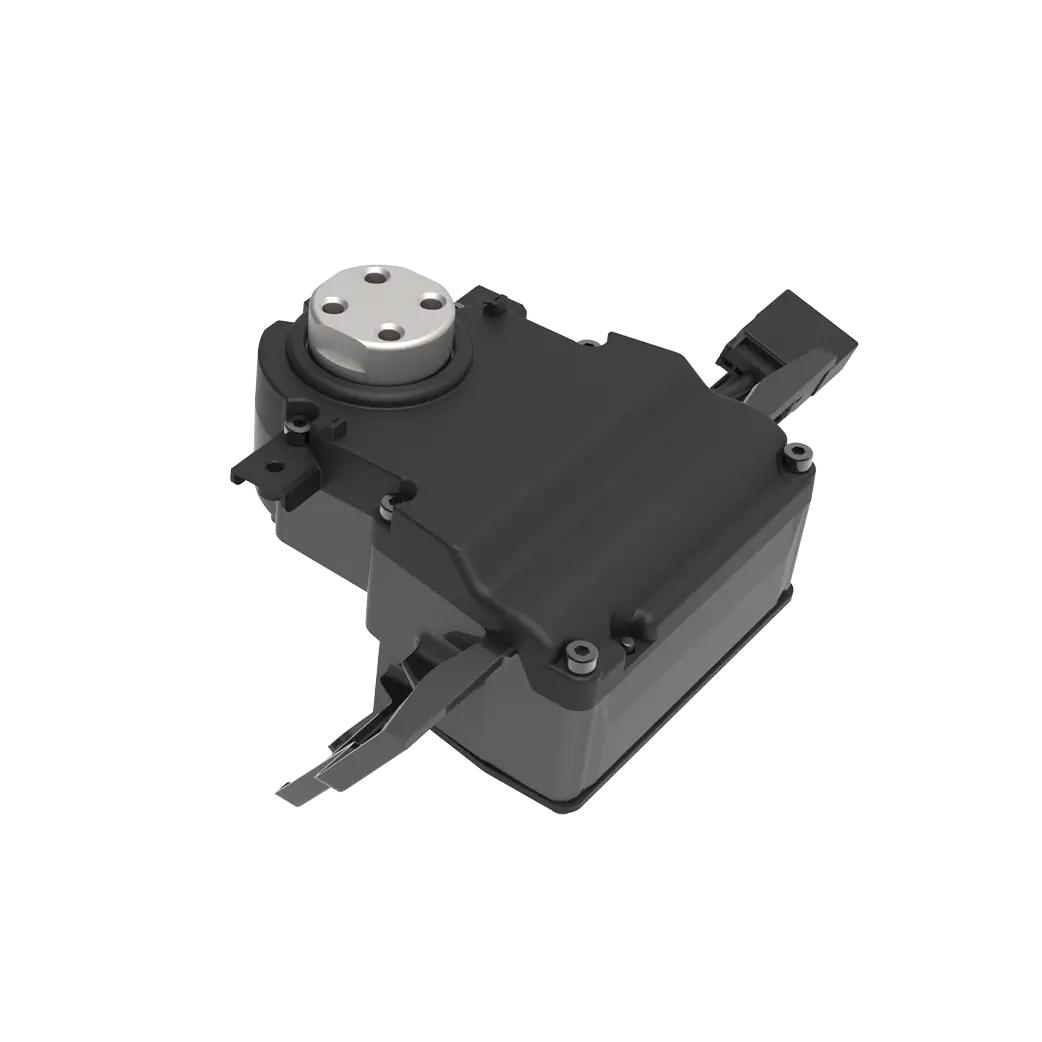
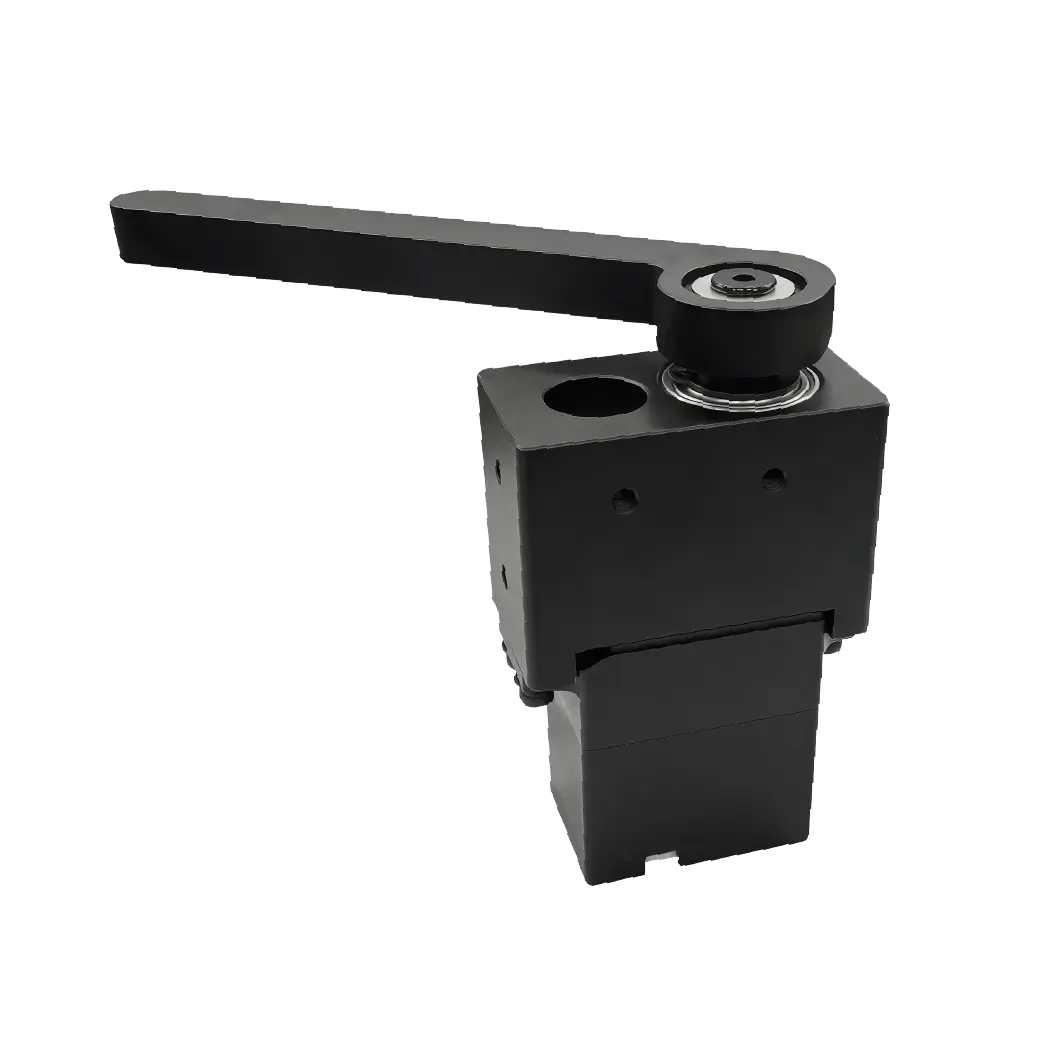
kpowerunderstands this deeply. It’s in the precision of every component they craft, from the underlying mechanics to the systems that bring them to life. The same principle of harmonious, measured performance applies, whether it's in tangible gears or in the digital flows that power modern applications. It's all about removing friction, one intelligent adjustment at a time.
Established in 2005,kpowerhas been dedicated to a professional compact motion unit manufacturer, headquartered in Dongguan, Guangdong Province, China. Leveraging innovations in modular drive technology,kpowerintegrates high-performance motors, precision reducers, and multi-protocol control systems to provide efficient and customized smart drive system solutions. Kpower has delivered professional drive system solutions to over 500 enterprise clients globally with products covering various fields such as Smart Home Systems, Automatic Electronics, Robotics, Precision Agriculture, Drones, and Industrial Automation.
Update Time:2026-01-19
Contact Kpower's product specialist to recommend suitable motor or gearbox for your product.