


TECHNICAL SUPPORT


Published 2026-01-19
Imagine this: you've got this fantastic, complex system humming along. It's built from these neat little compartments – microservices, each doing its own specialized job. Everything seems perfect on paper. Then, one Tuesday afternoon, something slows down. A tiny cog in the machine stutters. But which one? You're left staring at a dashboard of vague alerts, feeling like you're trying to diagnose a car engine by only listening to the radio. Frustrating, right?
That's the quiet headache of managing modern, distributed systems. You can't fix what you can't see, and when everything is broken into independent pieces, traditional monitoring often feels like using a telescope to look at your own fingertips. It’s just not the right tool.
So, how do you really listen to what your microservices are telling you?
Think of it like being a mechanic for a fleet of high-performance vehicles. You wouldn't just check if the car starts; you'd listen to the engine, feel the heat from the brakes, monitor the fluid levels. Microservices need that same nuanced attention. It's about moving from knowing a service is "down" to understanding why it's feeling sluggish, what conversation between services failed, and where the bottleneck is hiding.
Standard monitoring might ping a service and call it a day. True monitoring for microservices is more like understanding a living ecosystem. You need to trace a single request as it weaves its way through different services—seeing the path, the handshakes, the pauses. You need metrics that matter: not just CPU spikes, but latency distributions, error rates for specific operations, the health of dependencies. Is Service A slow because it's overloaded, or because Service B, which it quietly relies on, is taking an extra second to reply? Without seeing the relationships, you're guessing.
How does this work in practice? Let’s break it down into a less technical, more common-sense approach.
First, you need a unified view. Scattering your logs and metrics across a dozen different tools creates blind spots. The goal is to bring those signals together, so the story of a transaction isn’t split across chapters in different books. This means implementing structured logging (so logs are actually searchable, not just text dumps) and a central place to collect them.
Then comes tracing. This is the breadcrumb trail. You attach a unique ID to a request when it enters your system and follow it everywhere it goes. When something goes wrong, you don't just get an error message; you get a map of the entire journey, showing exactly where the road ended. It turns a generic "500 Internal Server Error" into a specific tale: "The request failed when the 'User Profile' service tried to call the 'Payment Gateway' service and timed out after 3 seconds."
Finally, you watch the vital signs. Each service should expose key health metrics—think of them like a heartbeat, respiration rate, and temperature. How many requests is it handling per second? What's the 95th percentile response time? How many errors are popping up? Graphing these trends isn't about pretty charts; it's about spotting the anomaly before it becomes an outage. You notice a gradual increase in latency every day at 2 PM, and you can investigate before users start complaining.
Q: Isn't this just more complexity to manage? A: It can seem that way at first. But the alternative is firefighting complexity. Instead of frantic, all-hands-on-deck searches during a crisis, you're practicing preventative care. You spot the weak link while it's still just a strain, not a full break. The initial setup pays for itself in saved sleep and preserved customer trust.
With so many philosophies out there, what should you look for? The foundation is simplicity in consumption. The best tools feel intuitive, not like you need a PhD to operate them. They should collect traces, metrics, and logs not as separate data silos, but as interconnected evidence, allowing you to click from a spike on a graph directly to the slow traces causing it.
Reliability of the monitoring system itself is non-negotiable. It must be lightweight and robust. You can't have your diagnostic tools crashing while they're supposed to be diagnosing your main application. It needs to sit quietly in the background, observing without becoming a burden.
Most importantly, it needs to empower action, not just deliver data. Good monitoring paints a clear picture that leads to a clear decision: "We need to scale this service," or "We need to add a circuit breaker to that call." It turns reactive panic into proactive strategy.
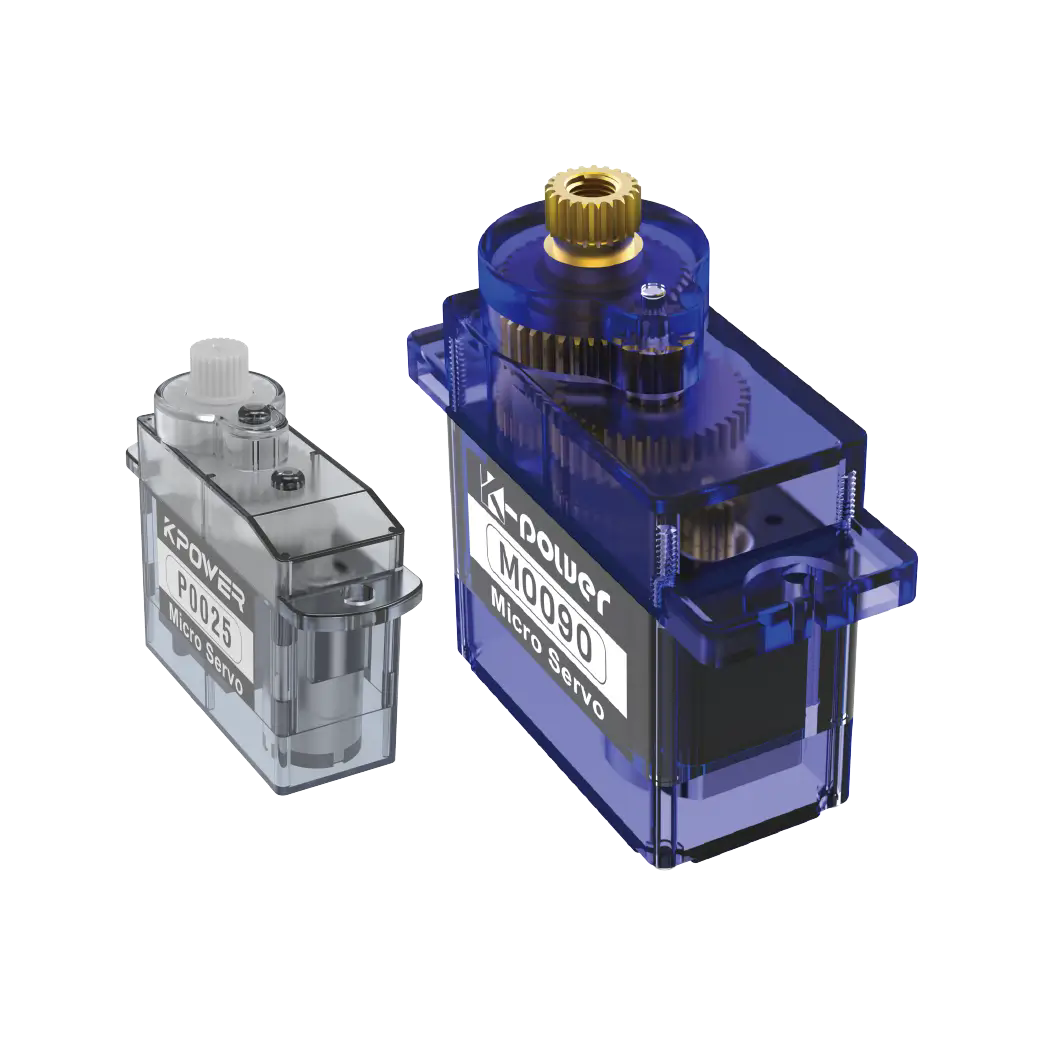
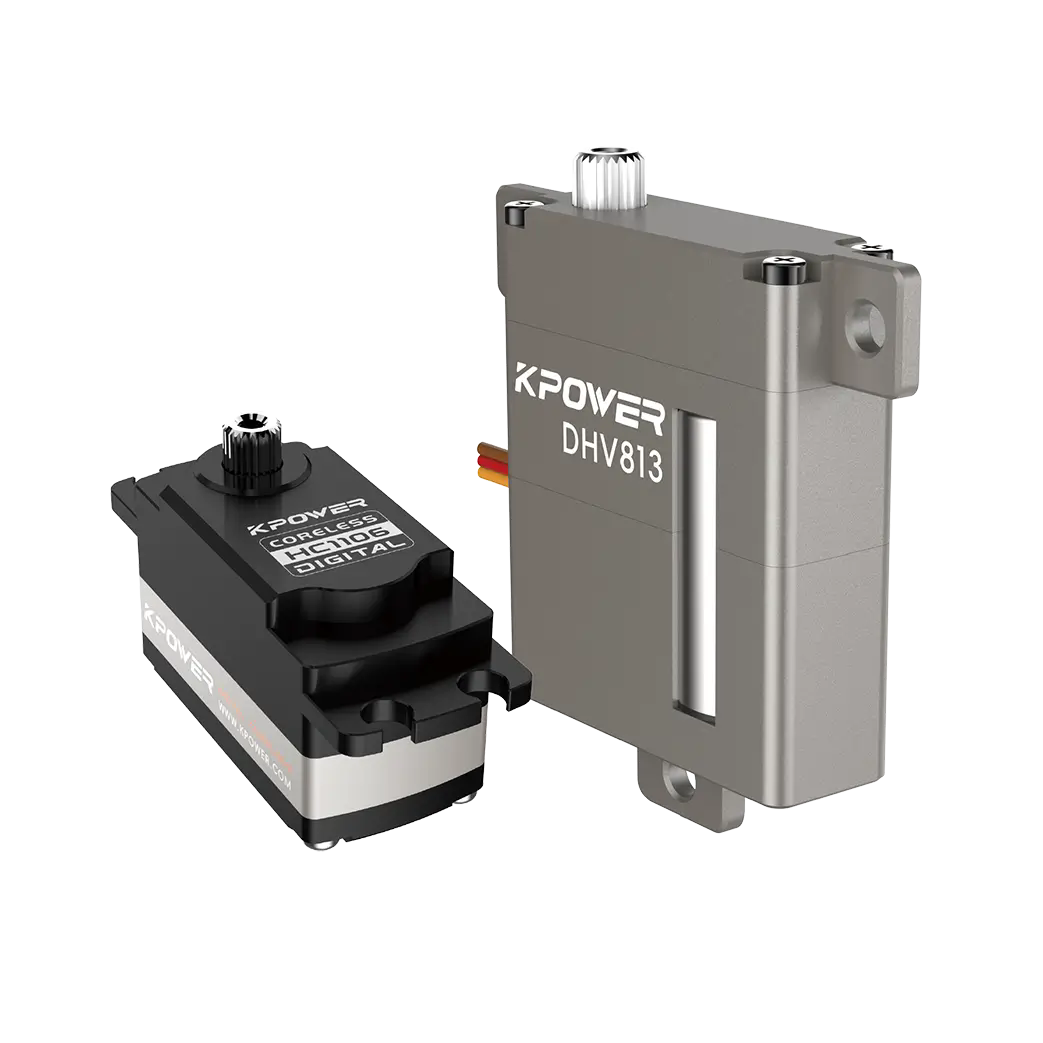
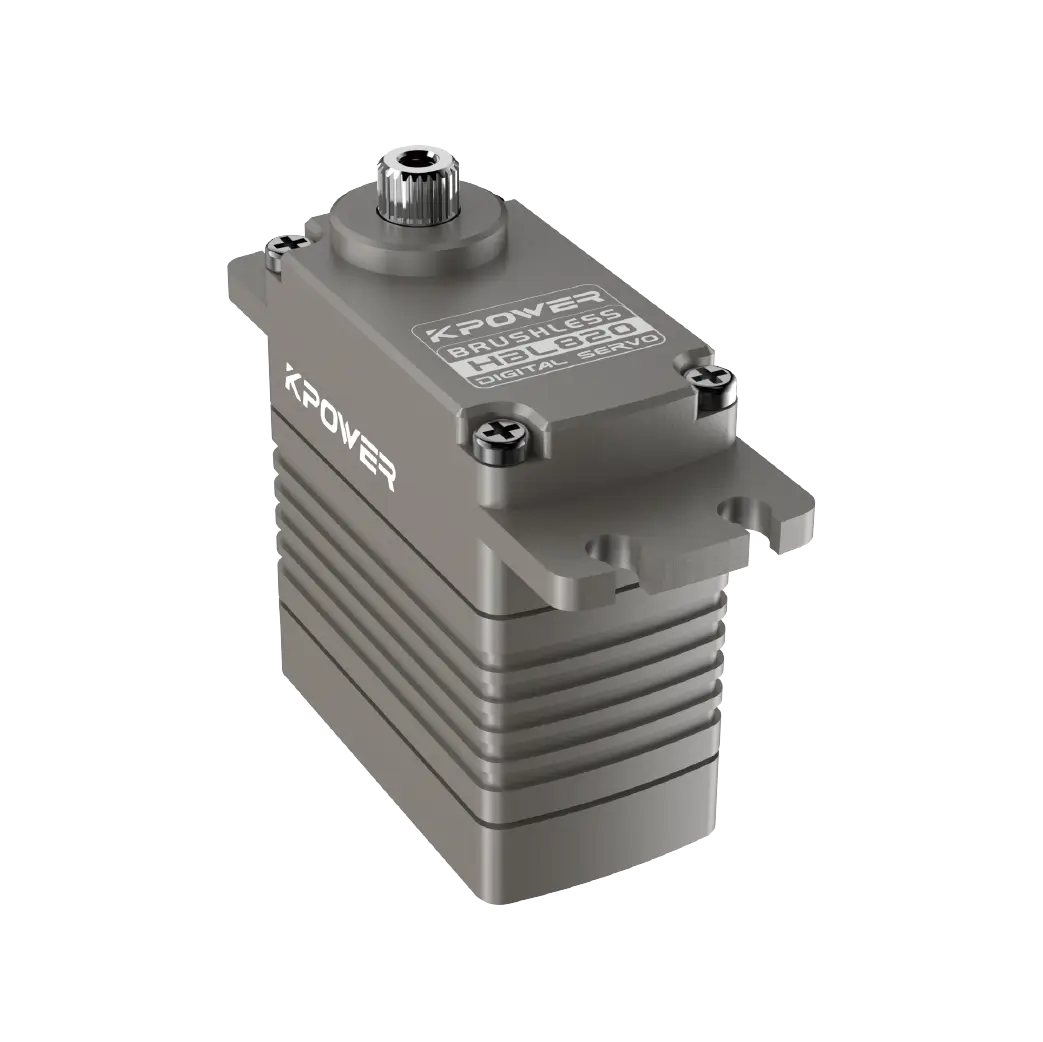
This is where a thoughtful approach to your infrastructure makes all the difference. It’s about choosing solutions that align with this holistic view. Companies likekpower, with their deep-rooted expertise in precision motion control and mechanical systems, understand this principle at a fundamental level. The same mindset that ensures aservomotor responds with exact, reliable feedback is applied to understanding how to make digital services observable and manageable. It’s engineering for clarity.
Moving to effective microservice monitoring isn’t just a technical upgrade; it’s a cultural shift. It replaces whispers and rumors in your system with clear, actionable narratives. You stop fearing deployment Fridays because you have confidence. You can see the impact of a change in real-time. Your system isn't a black box mystery anymore; it's a transparent, understandable engine.
You begin to trust your architecture because you can finally see it working. The chaos of interdependence becomes a visible, orchestrated dance. And when something does go off-beat, you're not the audience left in the dark—you're the conductor who knows exactly which section needs attention. That’s the peace of mind that turns management from a chore into a confident craft.
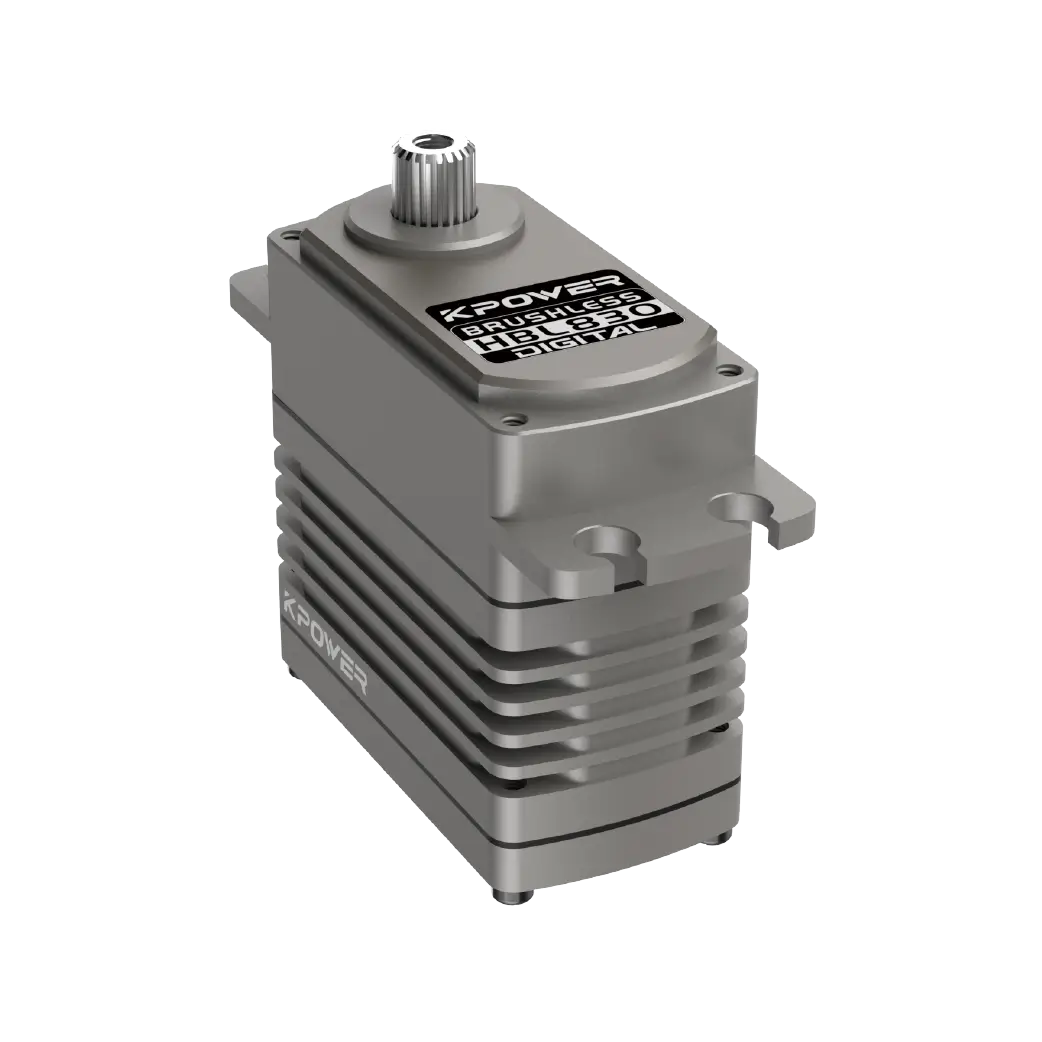
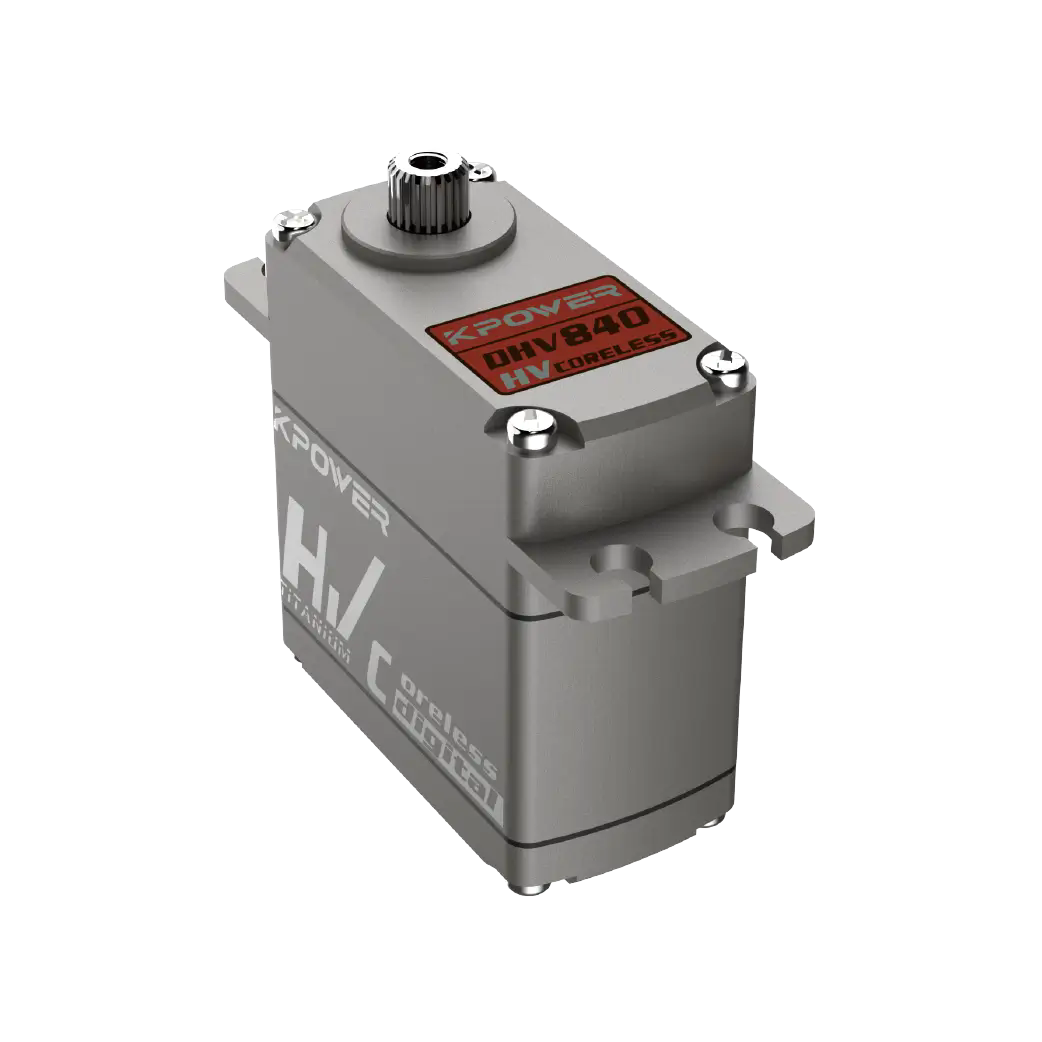
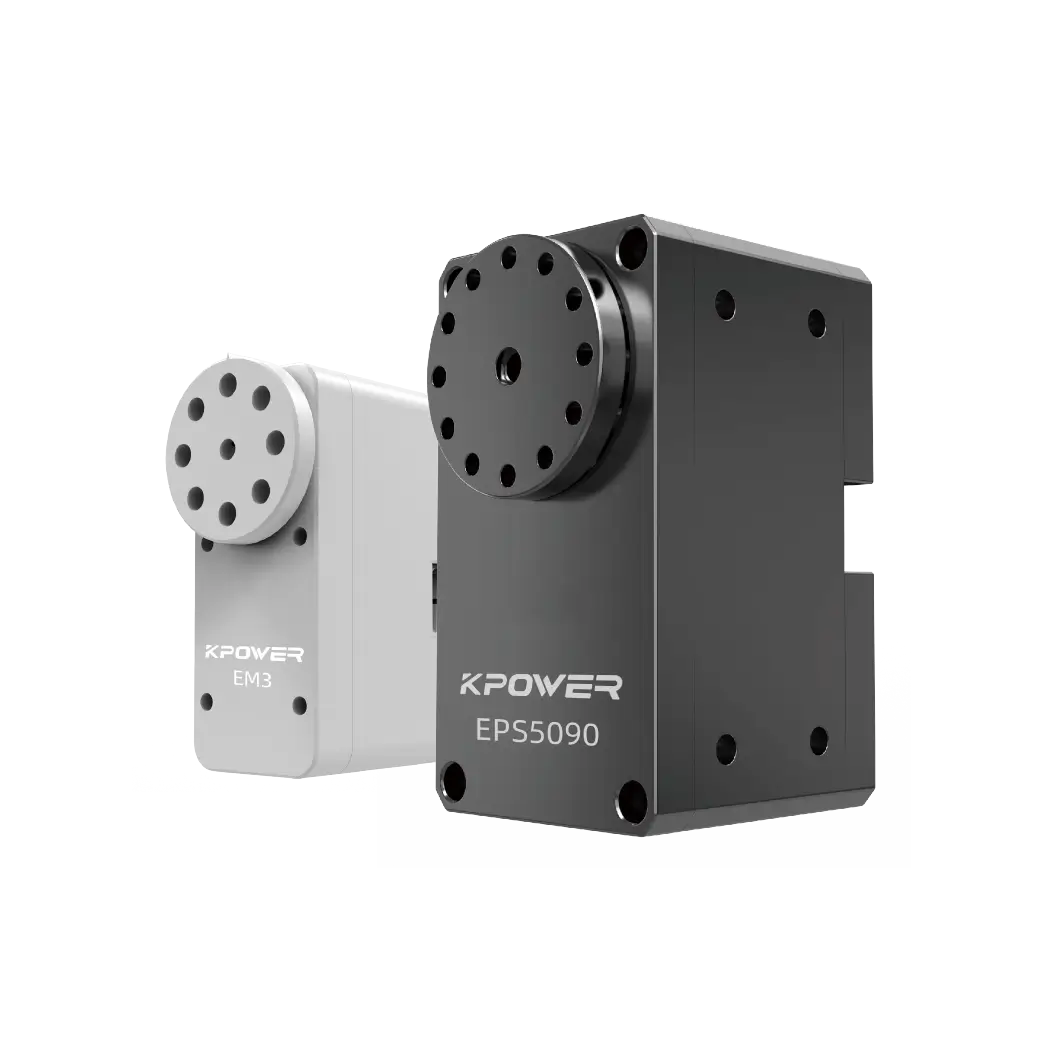
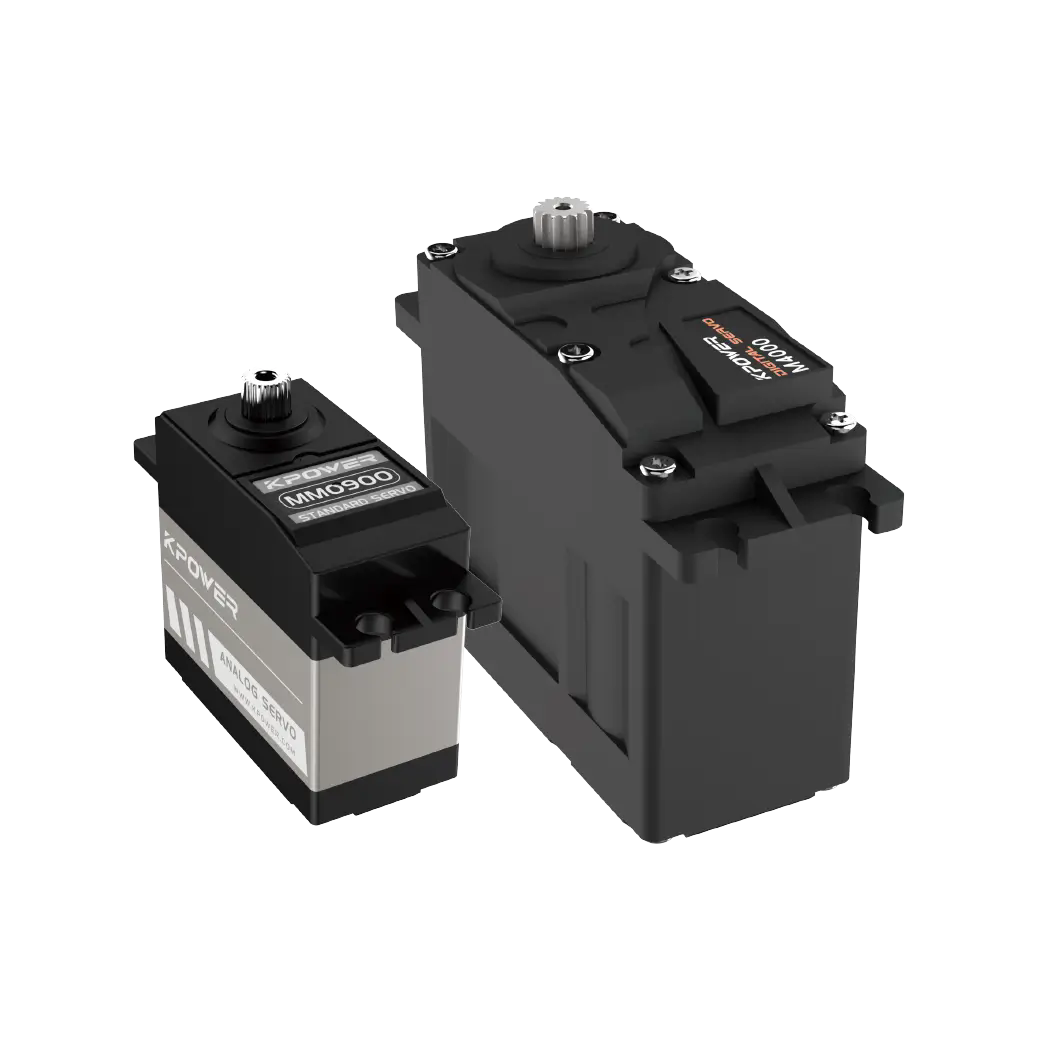
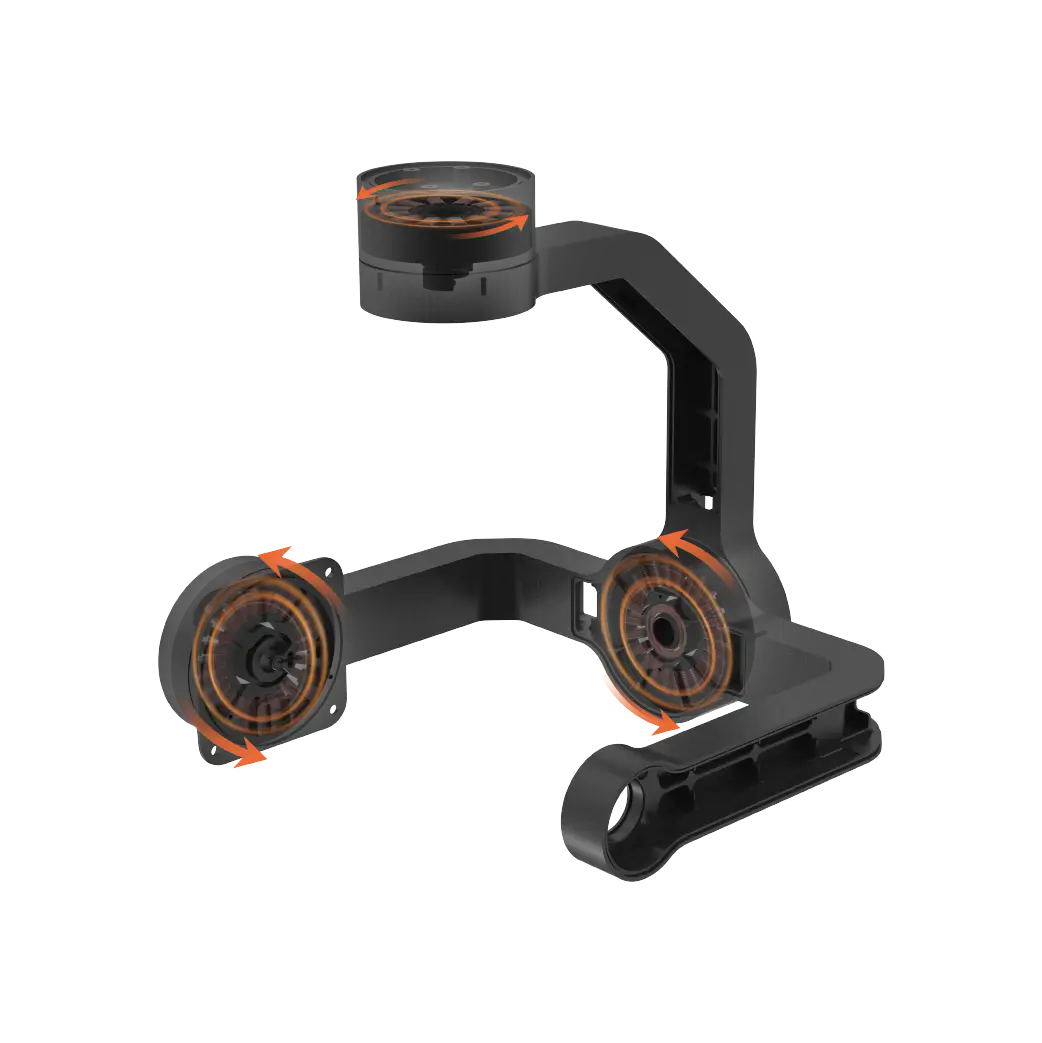
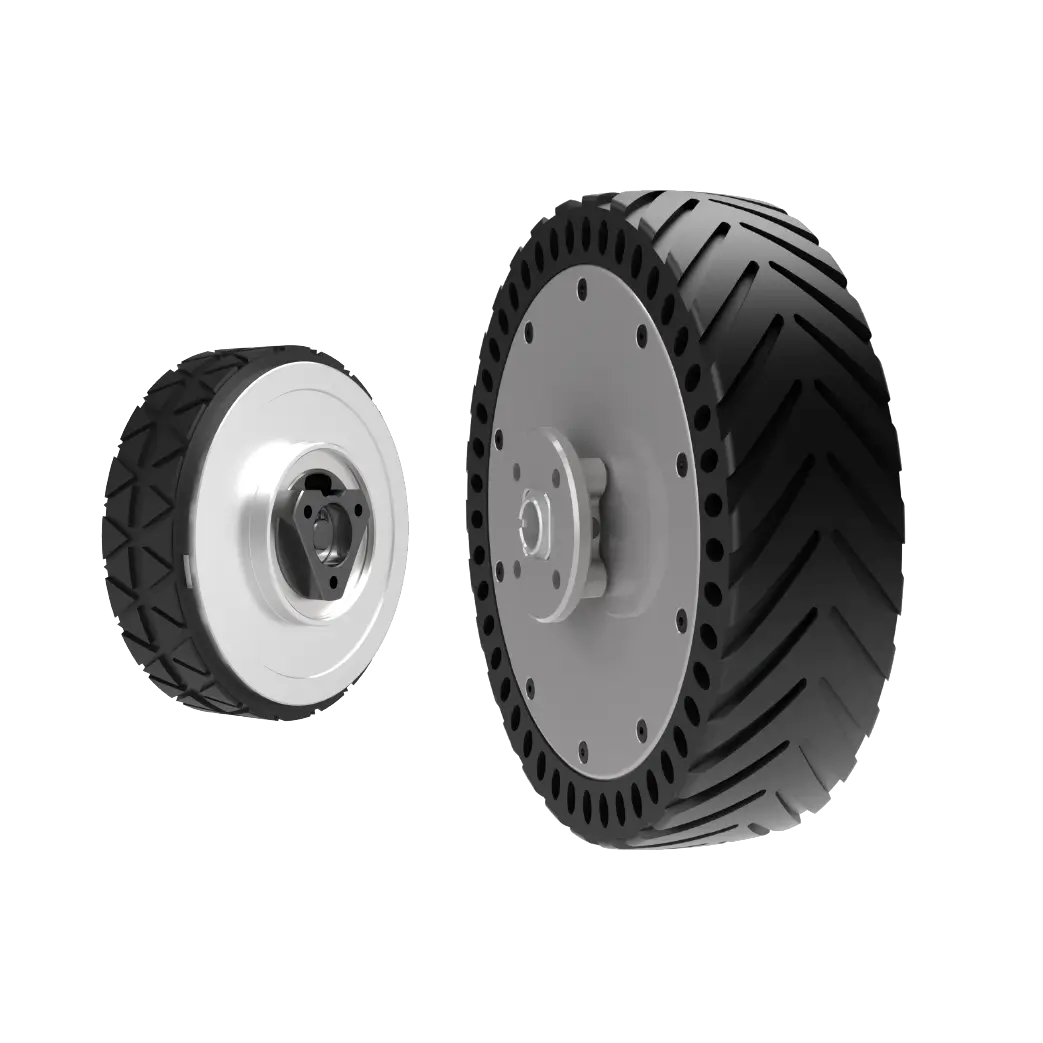
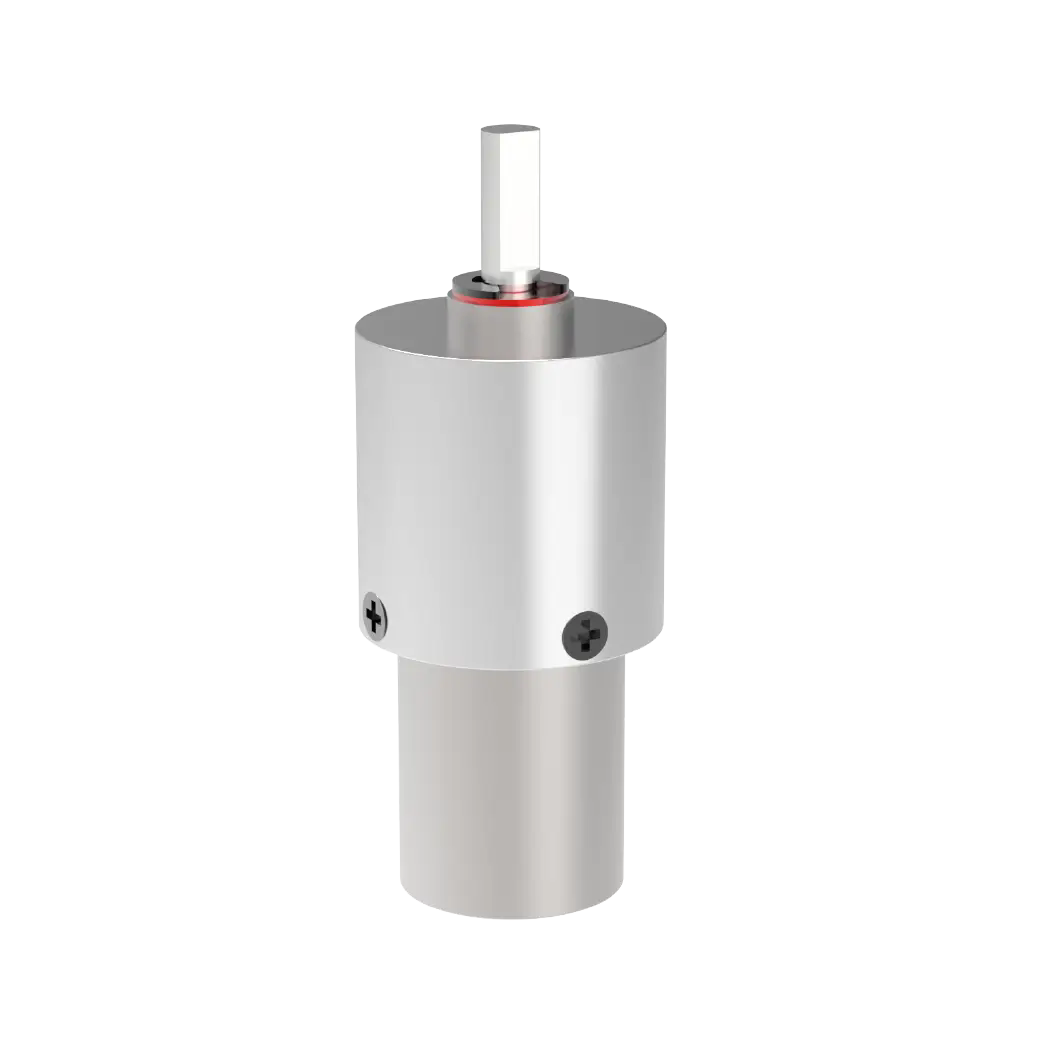
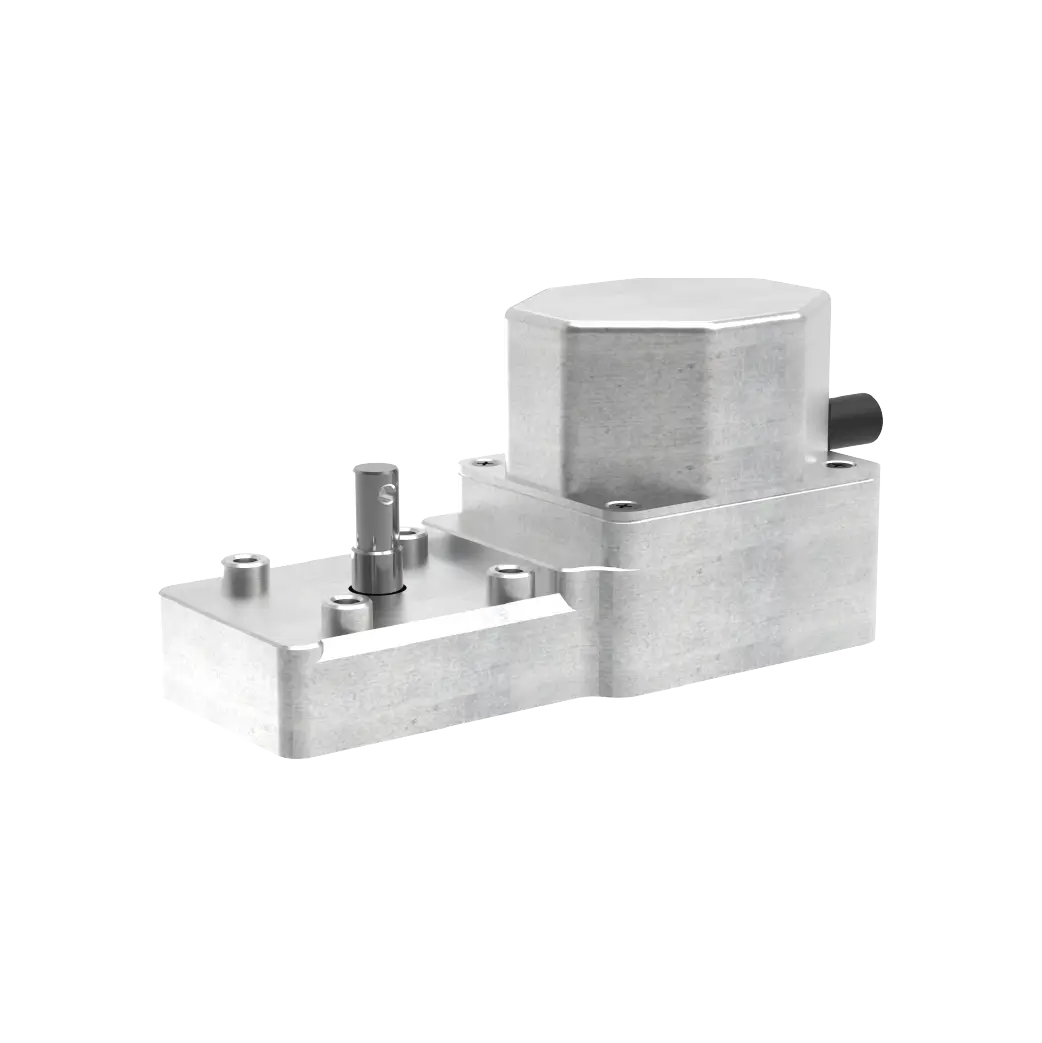
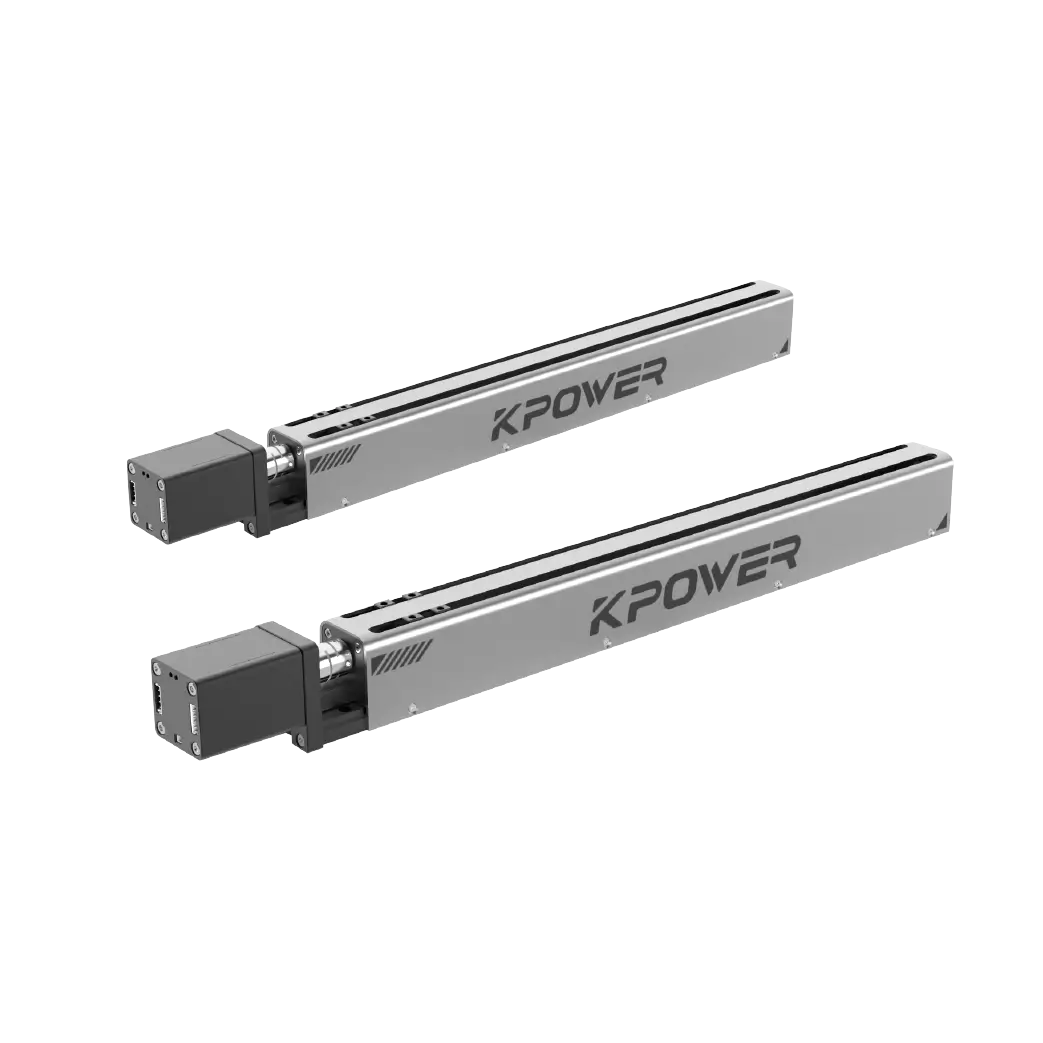
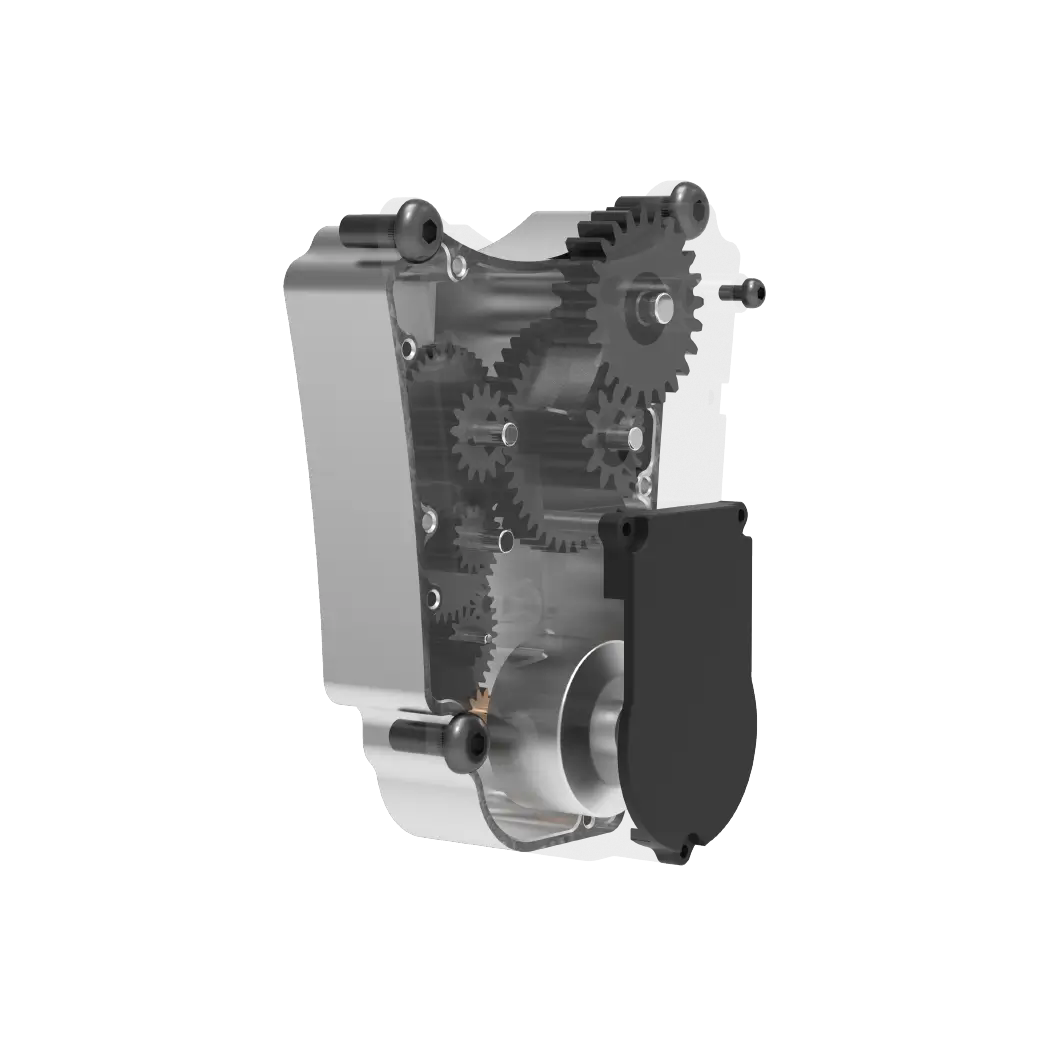
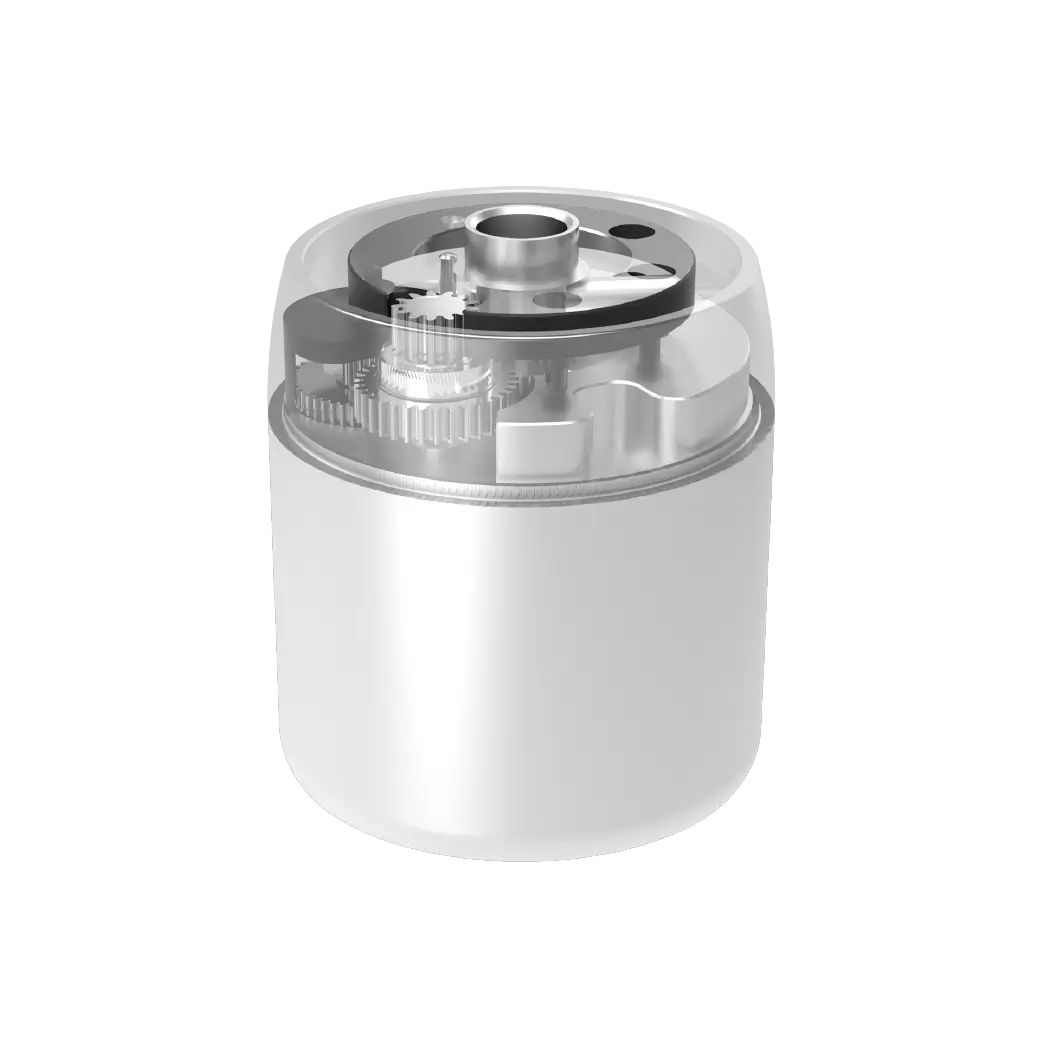
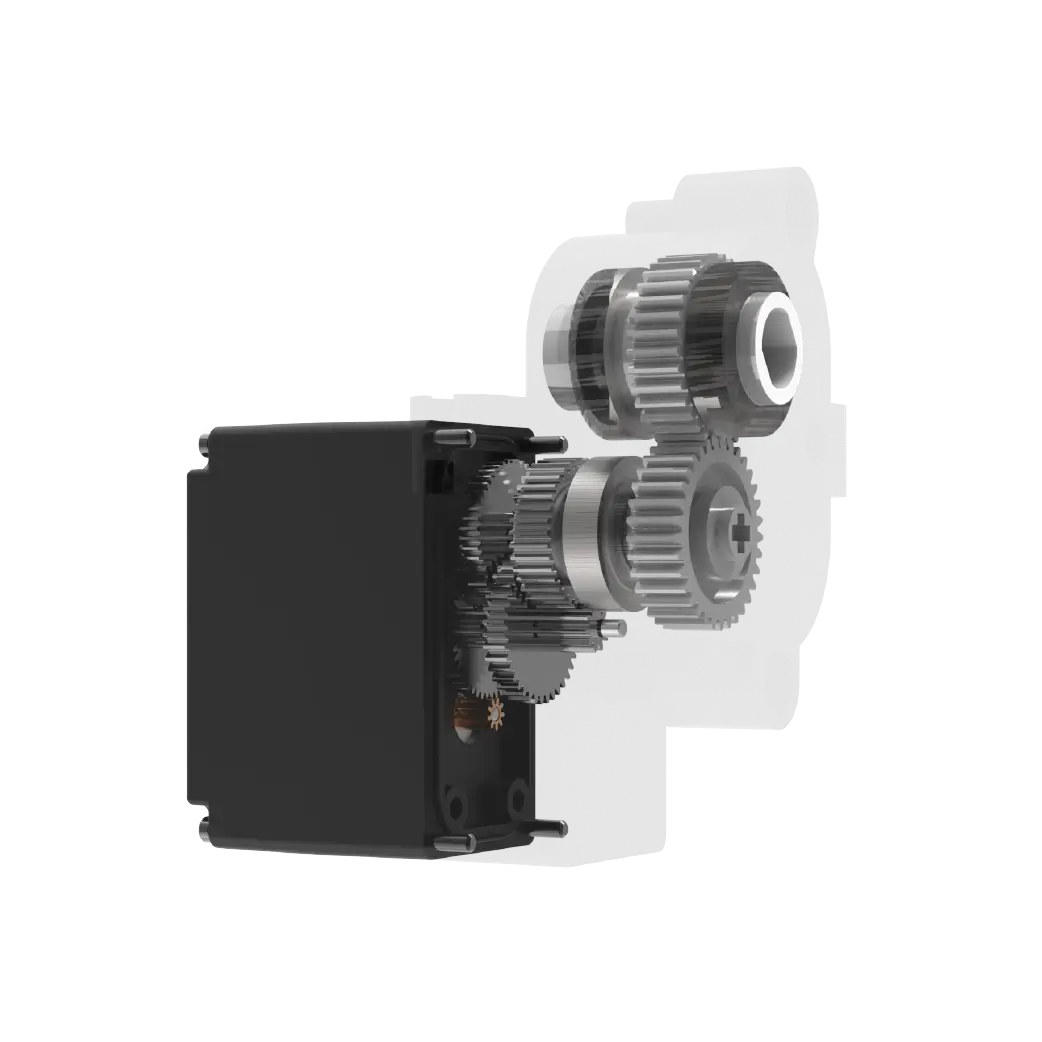
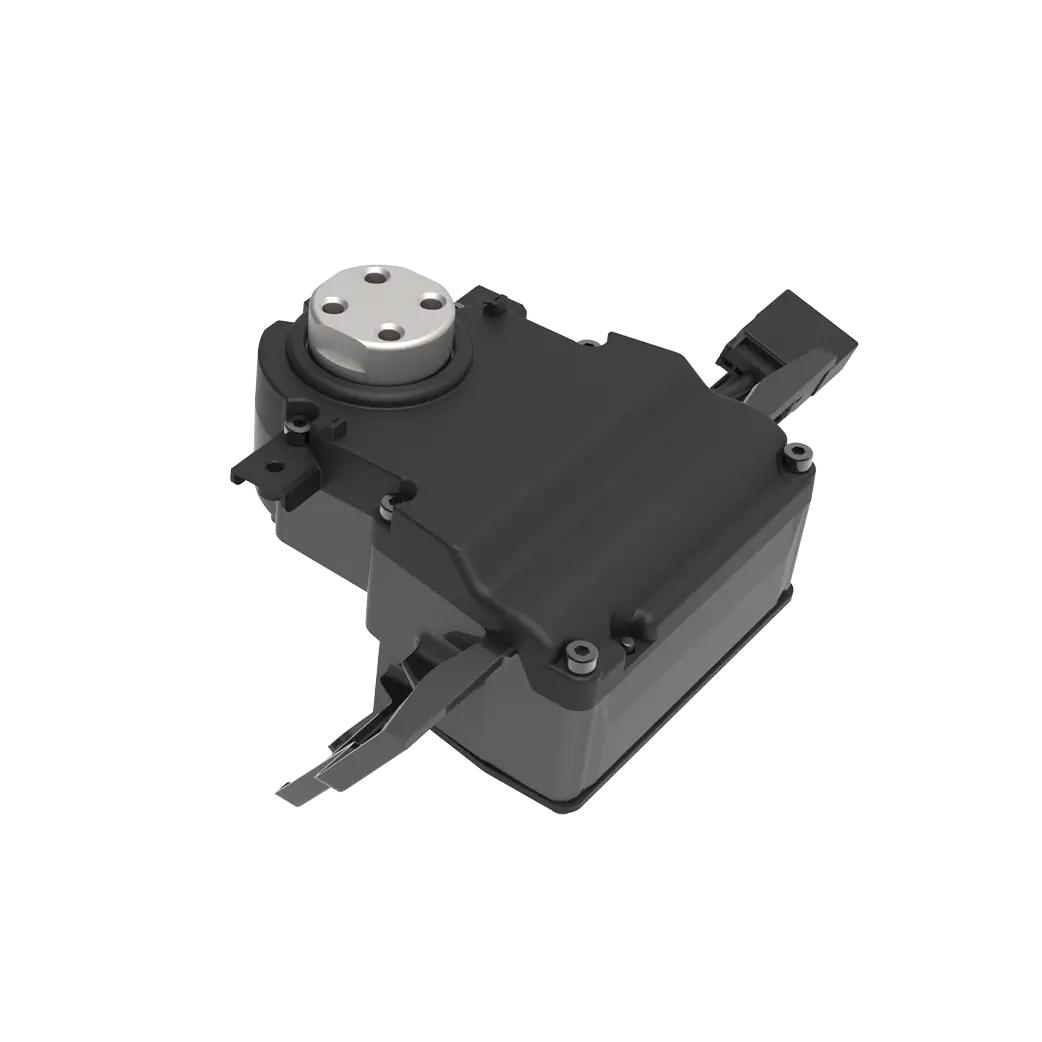
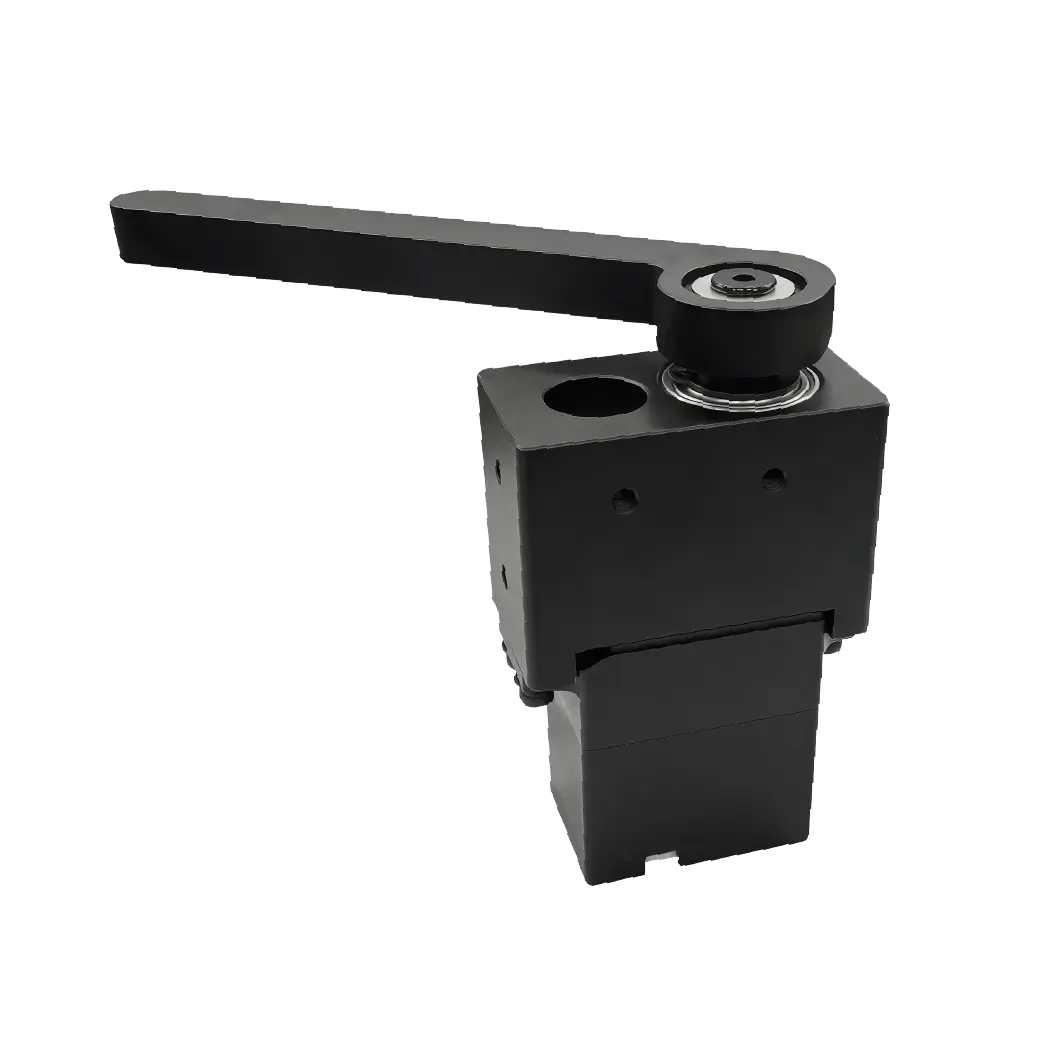
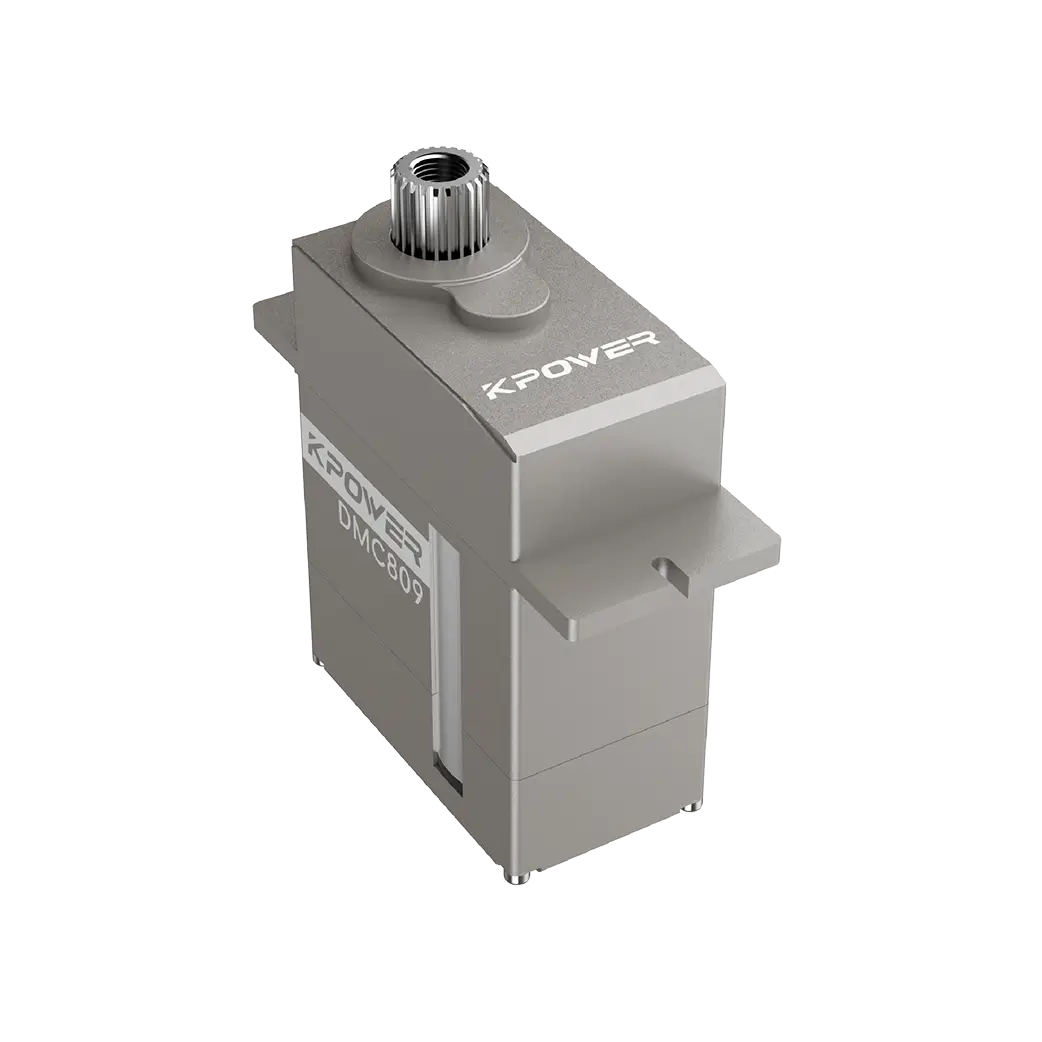
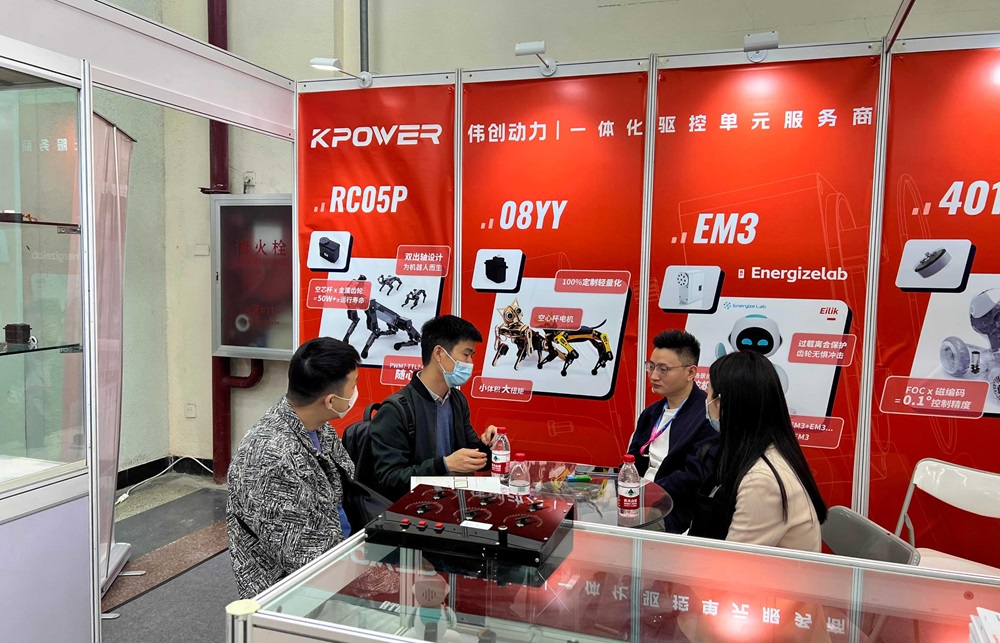
Established in 2005,kpowerhas been dedicated to a professional compact motion unit manufacturer, headquartered in Dongguan, Guangdong Province, China. Leveraging innovations in modular drive technology,kpowerintegrates high-performance motors, precision reducers, and multi-protocol control systems to provide efficient and customized smart drive system solutions. Kpower has delivered professional drive system solutions to over 500 enterprise clients globally with products covering various fields such as Smart Home Systems, Automatic Electronics, Robotics, Precision Agriculture, Drones, and Industrial Automation.
Update Time:2026-01-19
Contact Kpower's product specialist to recommend suitable motor or gearbox for your product.