


TECHNICAL SUPPORT


Published 2026-04-16
servofrequency characteristics define how aservomotor responds to changing input commands across different frequencies. In practical applications, understanding these characteristics is essential for achieving precise motion control, avoiding oscillation, and ensuring system stability. For example, when a robotic arm attempts to execute a fast pick-and-place operation, if theservo’s frequency response is insufficient, the arm will lag behind the command, causing missed targets or unstable motion. This guide explains the core concepts, measurement methods, and practical optimization strategies for servo frequency characteristics, based on industry-standard principles and real-world testing.
Servo frequency characteristics describe the relationship between the input command frequency (e.g., position, speed, or torque signals) and the output response of the servo system. The two most critical parameters are:
Bandwidth: The frequency range where the servo can respond without significant attenuation (typically defined as the frequency where output amplitude drops to -3 dB relative to the input).
Phase lag: The delay between input command and output motion, measured in degrees.
A common real-world case: In a conveyor belt sorting system, a servo is commanded to oscillate at 5 Hz to separate packages. If the servo’s bandwidth is only 3 Hz, the actual motion will be smaller in amplitude and delayed, leading to mis-sorting. Operators often observe this as “sluggish” or “vibrating” motion.
Poor frequency response directly affects three key performance areas:
When tracking a fast-changing trajectory (e.g., a CNC milling cutter following a complex curve), limited bandwidth causes tracking errors. For instance, a machining test with a 10 Hz sinusoidal path showed that a servo with 15 Hz bandwidth had a tracking error of 0.02 mm, while a servo with 8 Hz bandwidth produced errors over 0.1 mm – exceeding tolerance limits.
Excessive phase lag at higher frequencies can turn a stable system into an oscillating one. A typical case: In a camera gimbal, increasing the stabilization frequency to 20 Hz caused audible buzzing and visible jitter because the servo’s phase lag exceeded 60°, reducing the phase margin to below 30°.
Every mechanical structure has natural resonance frequencies. If the servo’s response excites these frequencies, components can overheat or fail. A documented case from a packaging machine: A servo running at 25 Hz command frequency matched the roller assembly’s 24 Hz natural frequency, causing excessive vibration that loosened bolts within 48 hours.
Three reliable methods are used in industry, listed from most accurate to most practical:
1. Connect a torque/velocity sensor or use the servo’s built-in encoder.
2. Apply a sinusoidal command signal with constant amplitude (e.g., 10% of rated speed) and sweep frequency from 0.1 Hz upward.
3. Record the output amplitude and phase at each frequency.
4. Find the frequency where output amplitude drops to 70.7% (-3 dB) of low-frequency amplitude – that is the bandwidth.
Example result: A typical mid-range servo used in automation shows -3 dB bandwidth between 20–50 Hz for position control and 100–300 Hz for current (torque) control.
Apply a small step command (e.g., 10% of max speed) and measure the rise time (10% to 90% of final value). Approximate bandwidth (Hz) ≈ 0.35 / rise time (seconds). For a servo with 5 ms rise time, estimated bandwidth ≈ 70 Hz. This method is useful in field diagnostics without specialized equipment.
Many modern servo drives include auto-tuning functions that generate Bode plots automatically. Run the auto-tuning routine while the mechanical load is connected – this gives the actual system bandwidth including load inertia and friction.
Based on common field issues, these factors consistently reduce bandwidth and increase phase lag:
Follow this action plan to maximize bandwidth and minimize phase lag while maintaining stability.
Use the frequency sweep test (Section 3.1) to establish a baseline. Document the -3 dB bandwidth and phase margin at that frequency.
Shorten and stiffen couplings between servo and load.
Replace flexible shafts with rigid connections where possible.
Case example: A pick-and-place robot increased bandwidth from 22 Hz to 38 Hz simply by replacing a rubber jaw coupling with a metal bellows coupling.
Keep load-to-motor inertia ratio below 5:1 for general applications,below 3:1 for high-dynamic uses. If ratio exceeds 10:1, add a gearbox (which reduces reflected inertia by the square of the gear ratio).
Always tune in this sequence:
1. Current (torque) loop: Set bandwidth 5–10x higher than velocity loop. Target >500 Hz for most servos.
2. Velocity loop: Increase proportional gain until slight oscillation, then reduce by 20%. Integrator should be just enough to eliminate steady-state error.
3. Position loop: Set bandwidth 1/5 to 1/3 of velocity loop bandwidth. For a velocity loop at 100 Hz, position loop bandwidth should be 20–33 Hz.
If mechanical resonance appears (sharp peak in frequency response), install a notch filter at the resonant frequency. Start with a depth of -10 dB and width of 10% of center frequency. Never use notch filters below 50 Hz as they severely reduce phase margin.
Run the most demanding motion profile your system will encounter. Measure following error and settling time. A well-optimized servo should have following error less than 1% of motion range and settle within 2–3 cycles after a step command.
Reality: Excessively high bandwidth amplifies measurement noise and can excite unmodeled resonances. A clean 40 Hz bandwidth is often better than a noisy 80 Hz bandwidth. For most industrial robots, 30–50 Hz is optimal; for high-speed pick-and-place, 80–120 Hz is sufficient.
Reality: With proper tuning and mechanical optimization, the same servo can achieve 2–3x higher effective bandwidth. A documented upgrade: A labeling machine servo improved from 18 Hz (default tuning) to 52 Hz (optimized inertia ratio + PID tuning).
Core repeatable takeaway: Servo frequency characteristics – specifically bandwidth and phase lag – directly determine dynamic accuracy, stability, and mechanical life. A servo with insufficient bandwidth will never achieve the commanded motion, regardless of how powerful the motor is.
Immediate action steps for your application:
1. Measureyour current servo’s actual bandwidth using the step response method (0.35 / rise time). If below 20 Hz for position control, expect poor dynamic performance.
2. Comparerequired motion frequency: For a trajectory that changes direction every 0.05 seconds (10 Hz), your servo bandwidth must be at least 30–50 Hz (3–5x the operating frequency).
3. Optimizein this order: mechanical stiffness → inertia matching → current loop → velocity loop → position loop. Never skip mechanical inspection.
4. Validatewith a simple test: Command a 10 Hz sine wave at 50% of rated torque. If the actual position lags by more than 45° or amplitude drops below 80%, the system needs re-tuning.
By following this guide, you will achieve a servo system that responds accurately, remains stable under high-speed commands, and avoids the common pitfalls of oscillation and lag. Always document your frequency response measurements before and after changes – this data is essential for predictive maintenance and future upgrades.
Update Time:2026-04-16
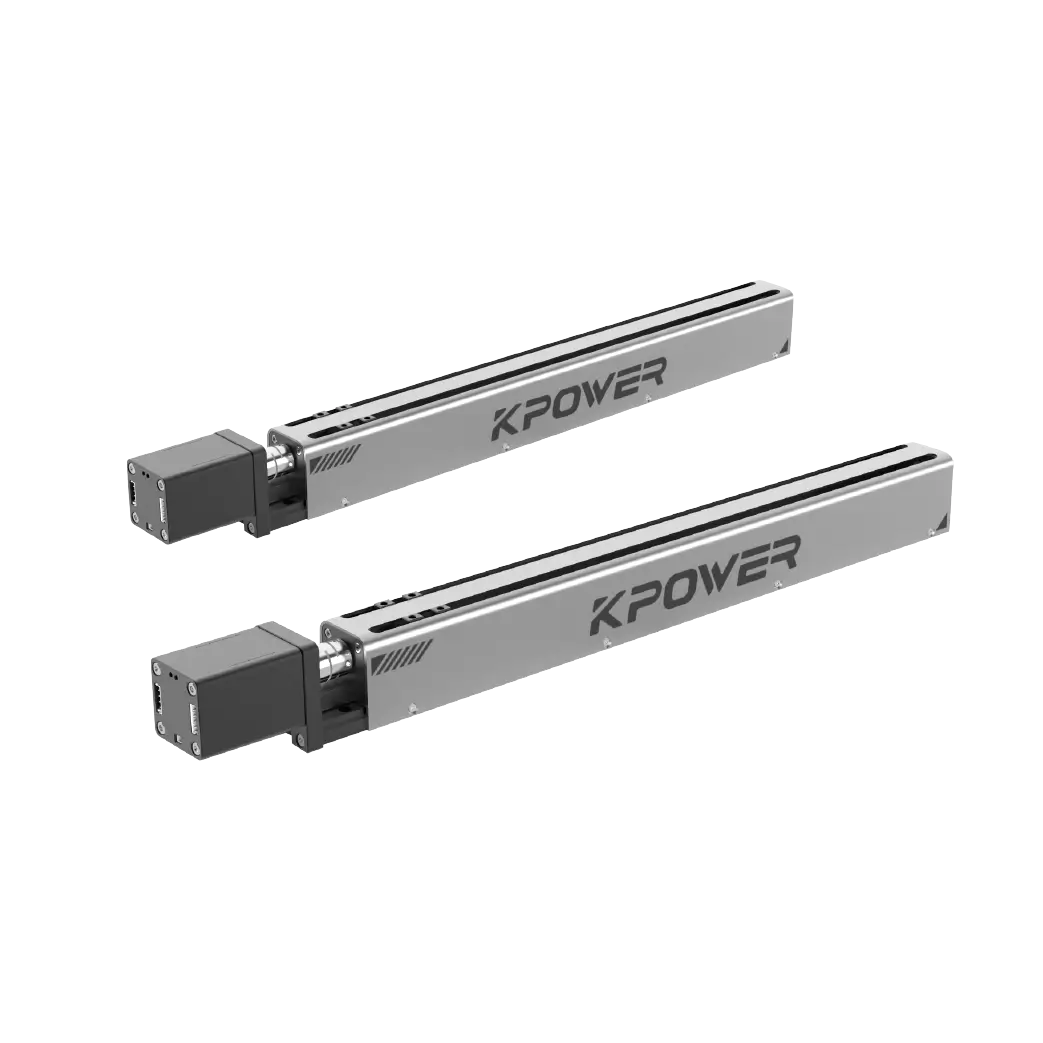
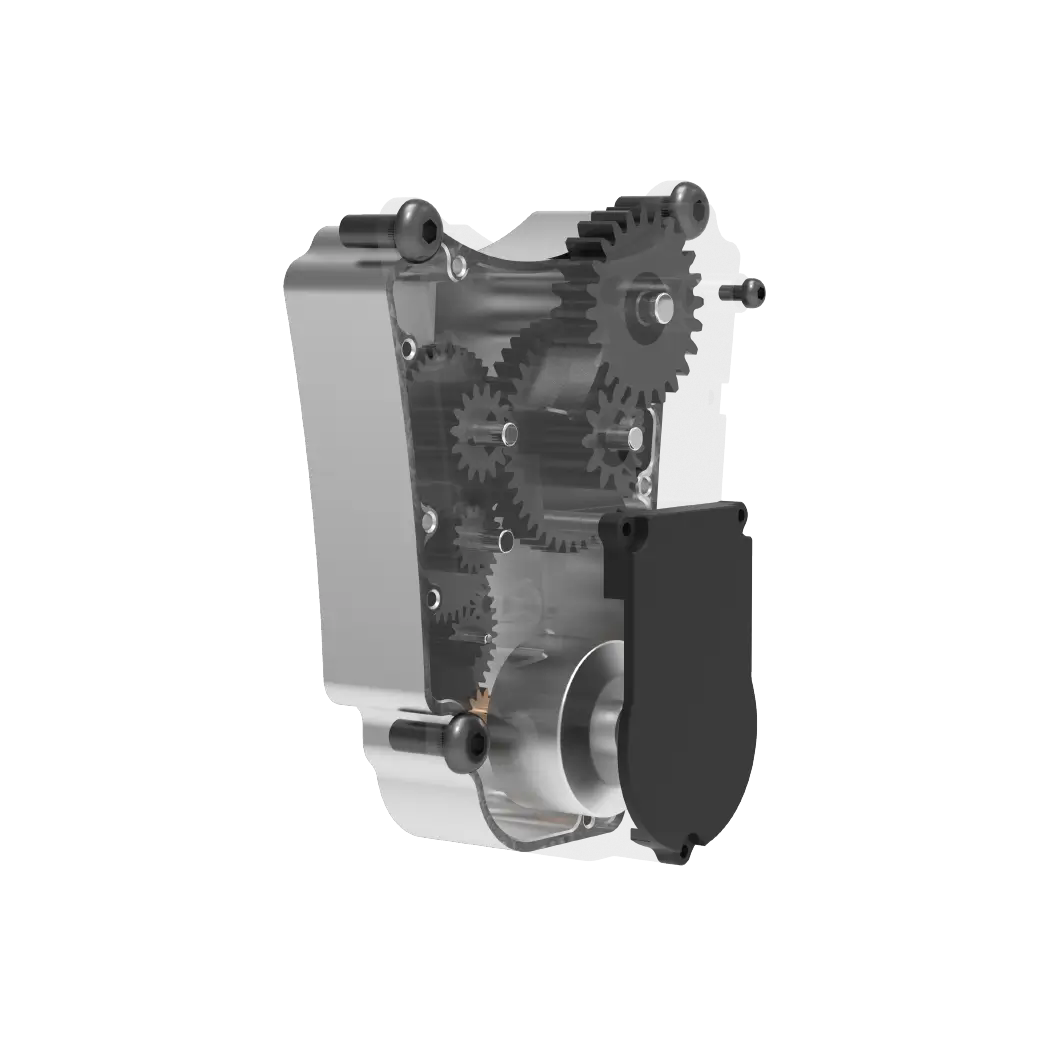
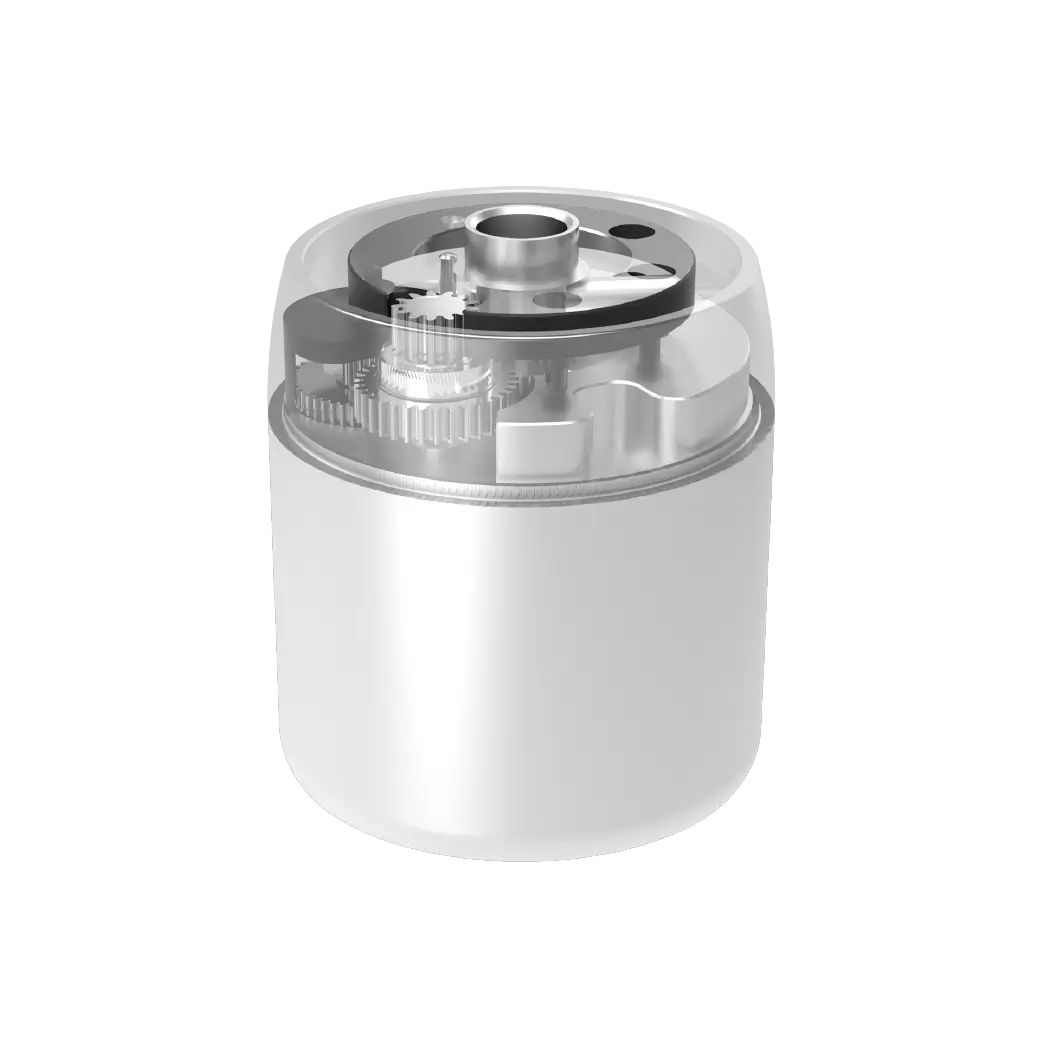
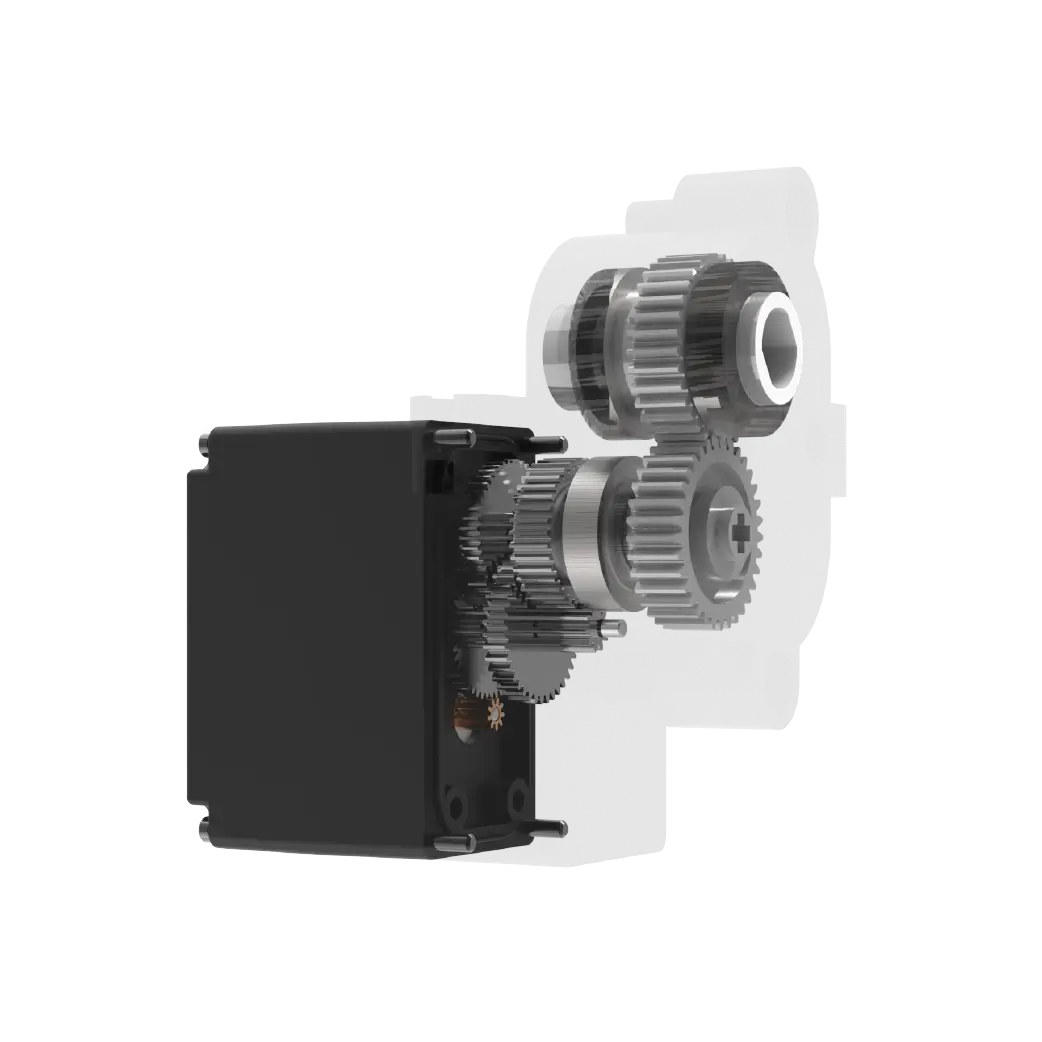
Contact Kpower's product specialist to recommend suitable motor or gearbox for your product.


