


TECHNICAL SUPPORT


Published 2026-01-19
Remember that project from last time? At three o'clock in the morning, the server suddenly slowed down to a crawl - but the monitoring chart was peaceful and green enough to make people panic. The team rummaged through the logs, and it wasn't until dawn that they discovered that a call chain between microservices was secretly "on strike." This kind of thing is like a water pipe leaking at home. It is the most troublesome to hear the ticking sound but not find the source.
Microservices break up the system and break the problem into pieces. A certain interface suddenly responds slowly, perhaps across five or six layers of services; the memory quietly leaks, and by the time it is discovered, it has affected three modules. What's even more troublesome is that traditional monitoring tools often focus on a single node, but cannot clearly see where the "conversation" between services is stuck.
We often encounter this situation: users complain that the page loads slowly, but the CPU and memory data are normal. What to do at this time? ——You have to look at the problem from another angle. In microservice architecture, the real bottlenecks are often hidden in the gaps between service interactions. An API call may pass through the gateway, authentication service, business module, database, and then cache. If any link sneezes, the entire link may catch a cold.
Therefore, monitoring cannot only measure body temperature, but also requires a "full body examination." You need to see the complete route of the request from entry to exit, and know which corridor and room the time is spent in. This is like taking an X-ray of the system, all the bones and veins must be clear.
What does a good monitoring tool do? It has to automatically discover dependencies between services. Without manual configuration, you can draw a call topology diagram—which service calls whom, how frequently, and what the response time is. When a certain link slows down, the upstream and downstream impact areas can be immediately located.
Be able to track the entire journey of a single request. Give each request a unique "passport number" that leaves a stamp as it passes through each service. In this way, no matter how far the request travels or how many turns it takes, its path and time distribution can be completely reproduced. At which stamping point does the sudden delay occur? It's clear at a glance.
Also, the data must be real-time. Wait for the report in an hour? The fault may have spread. A good monitoring system should be like a car dashboard. The speed, fuel level, and water temperature can be seen at any time, and lights will turn on immediately if there is any abnormality. More importantly, the data needs to be correlated: Did slow database queries cause service timeouts? Did cache invalidation trigger a chain reaction?
We have seen many teams fall into similar pitfalls: they only monitor hardware indicators and ignore application layer performance; logs are scattered everywhere, and you can find a needle in a haystack when there is a problem; too many alerts become a "crying wolf", and no one pays attention to real failures.
Effective approaches are often simple: start monitoring from key business interfaces and gradually expand to the entire link; set intelligent thresholds to avoid false alarms caused by static values; establish performance baselines to detect early signs of deviations from normality. Sometimes, the 99th percentile response time of a service quietly increases by 200 milliseconds - this may be an early signal of a major failure, and has more early warning value than a sudden surge of CPU to 100%.
When you evaluate a monitoring solution, ask: Can it automatically identify service relationships? How much code needs to be changed to track the link? Is the data visualization clear enough to understand the problem at a glance? Are the alarm rules flexible enough to differentiate between minor fluctuations in the early morning and serious malfunctions during the day?
Some tools seem to be fully functional, but are complex to deploy and require several days of maintenance every month; others are lightweight and flexible and focus on solving the core visibility problems.关键是找到那个平衡点——足够深入看到问题本质,又不会沉重到成为新负担。
After all, microservice monitoring is not about stacking data, but about establishing an observation capability. It makes invisible behavior of the system visible, allowing teams to detect problems before they impact users. It's like equipping a complex mechanical device with a network of sensors, where the rotation of every gear and the tension of every connection becomes a readable signal.
When we can clearly see every handshake and every conversation between services, the system is no longer a black box. You'll start to notice interesting patterns: the order service's response time will increase slightly every Friday afternoon because the associated inventory service is generating a weekly report; or a downstream service will take ten minutes to "warm up" after each new release.
These insights often lead to deeper insights - perhaps adjusting the order of calls can reduce latency by 30%; or adding a simple cache to a service can relieve the pressure on the entire link.
In the world of microservices, performance problems are no longer a point of failure, but ripples on a network. Finding the right way to look means you can gently smooth the water before the ripples spread. After all, the best troubleshooting is to prevent it from happening at all.
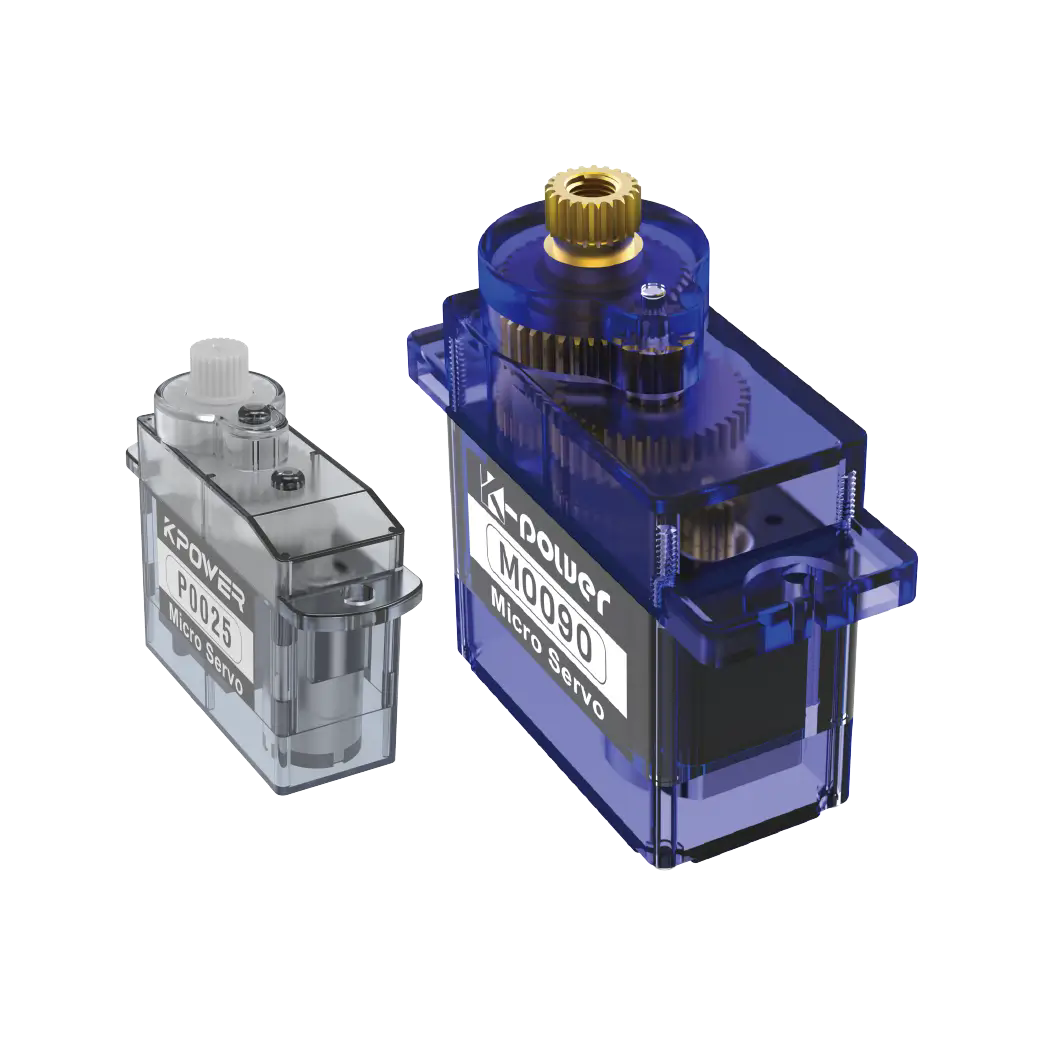
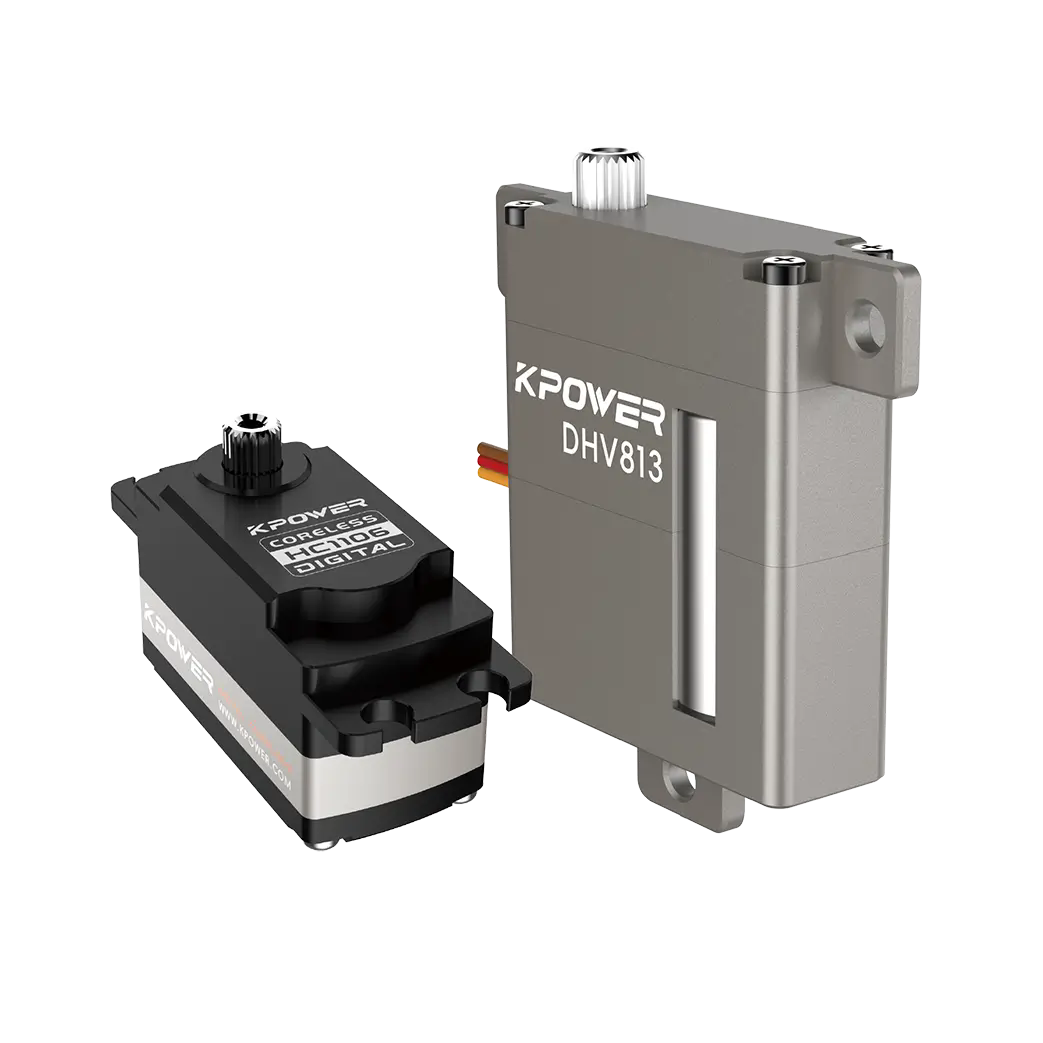
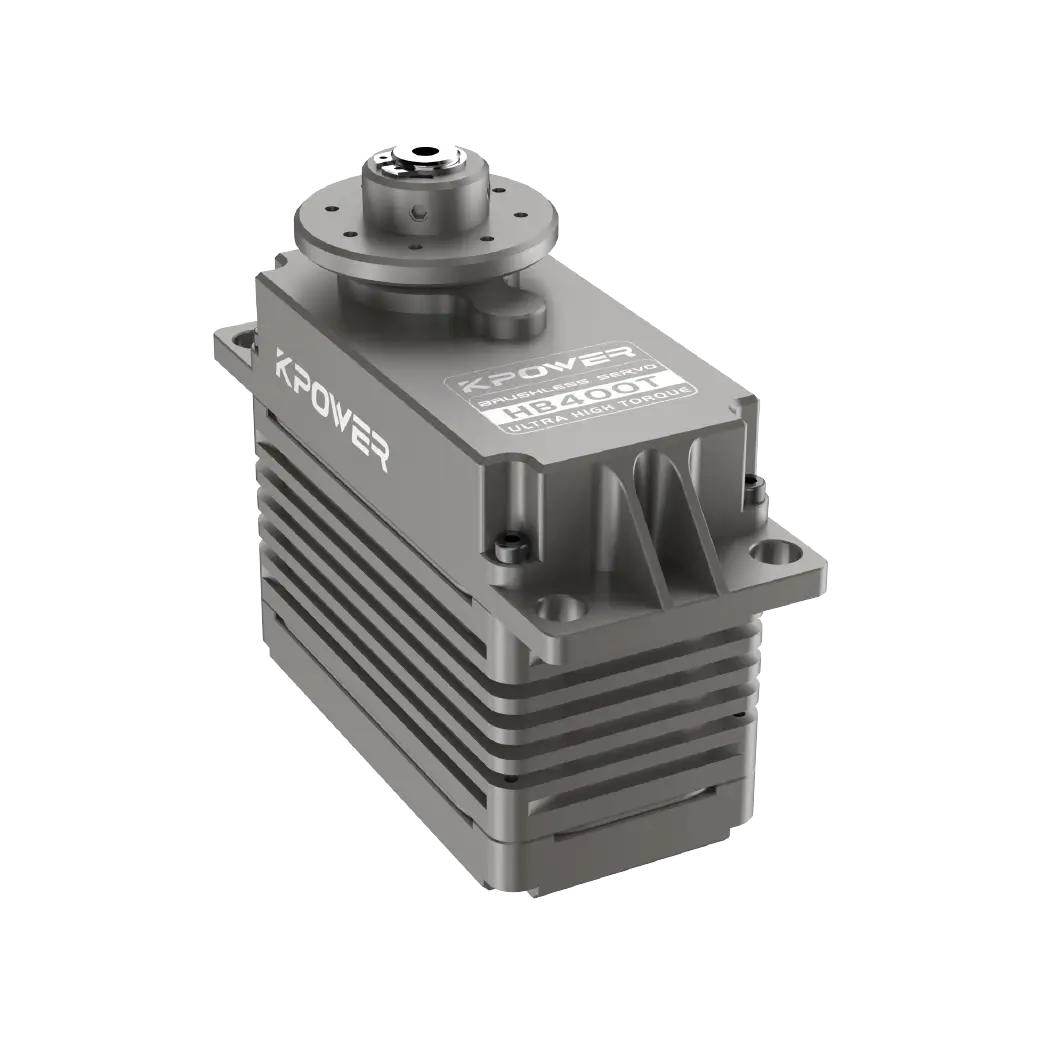
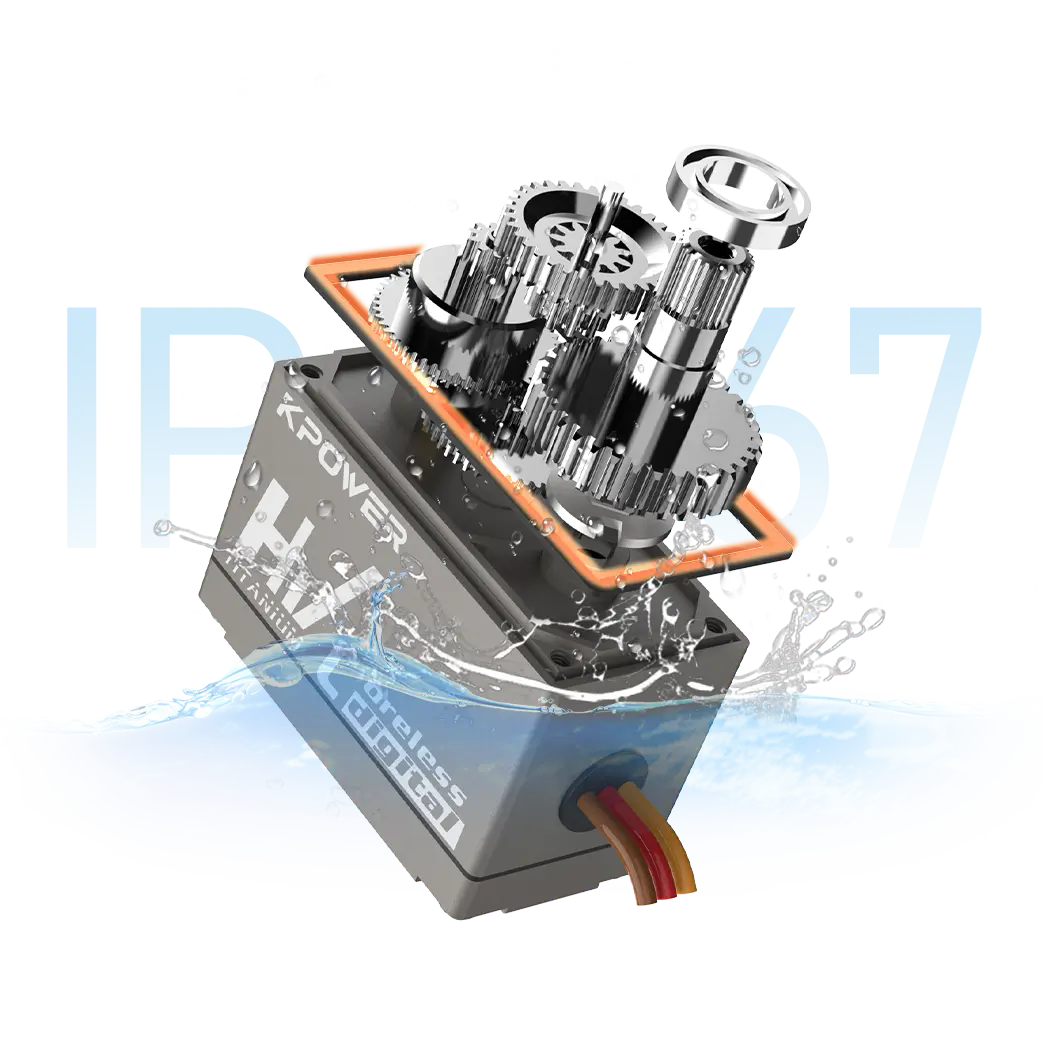
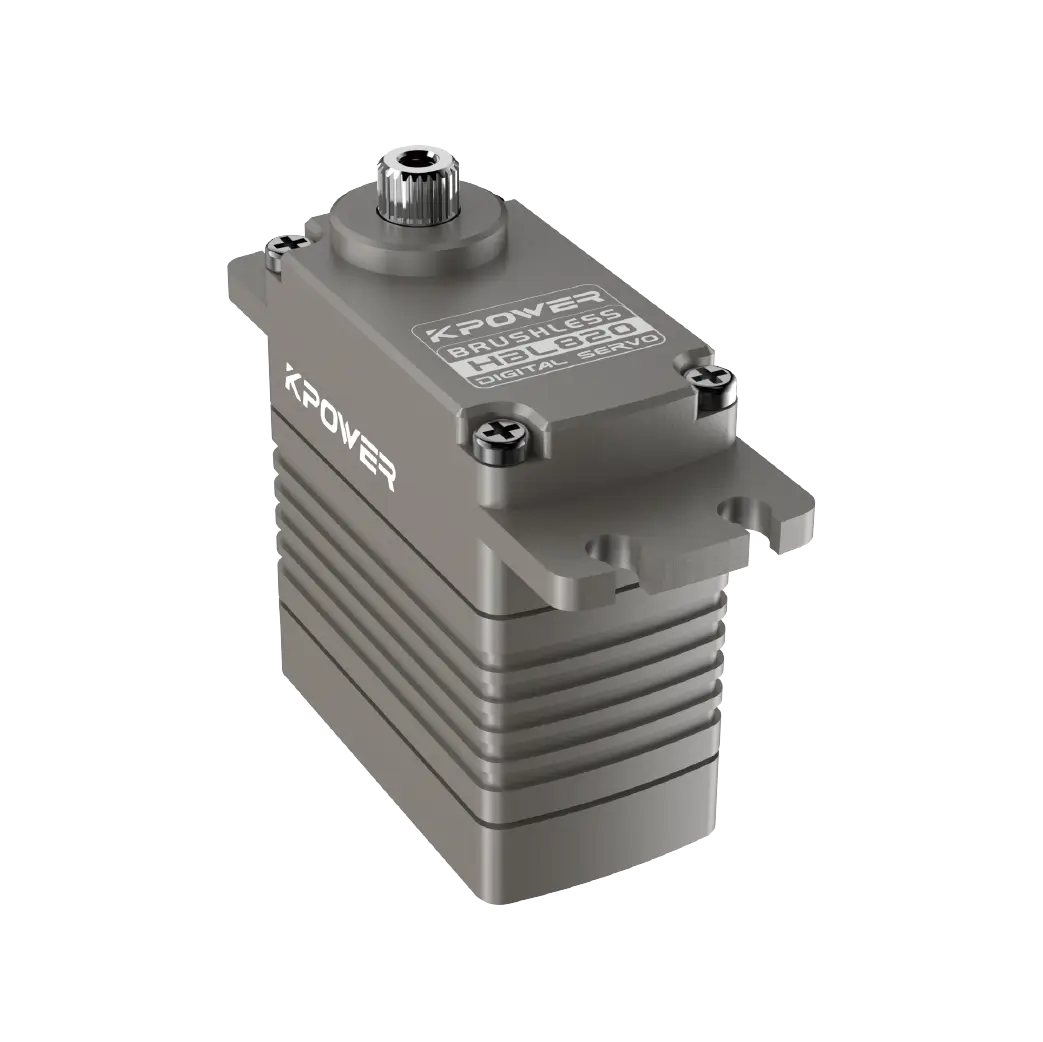
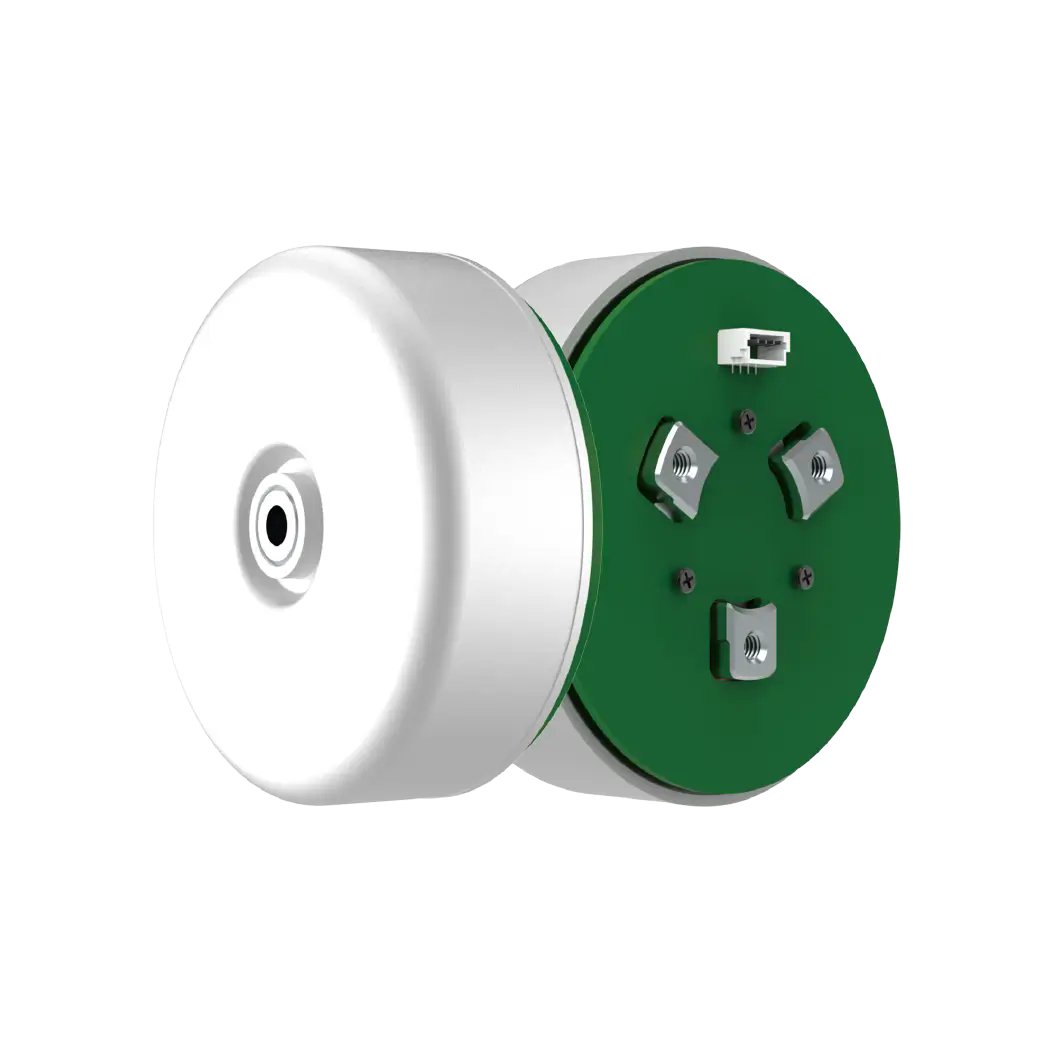
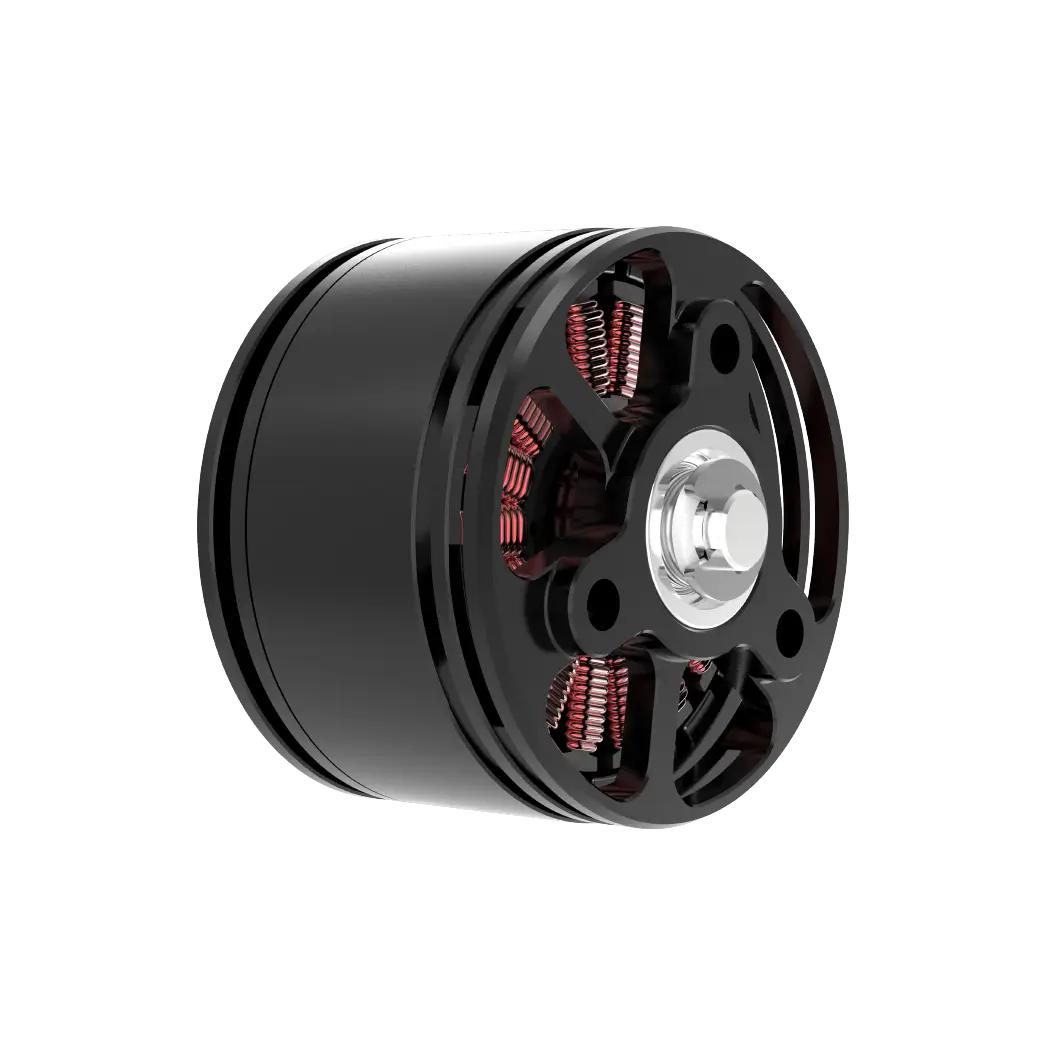
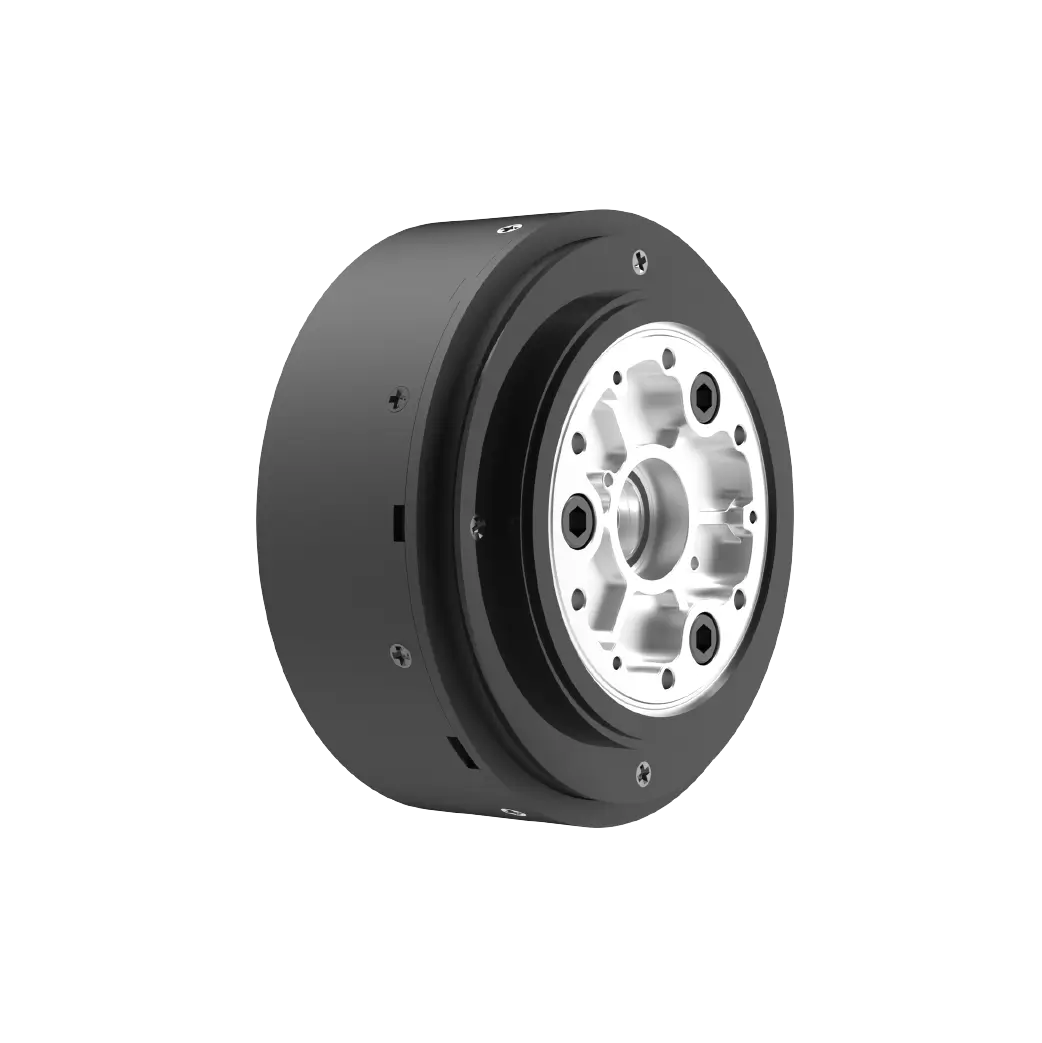
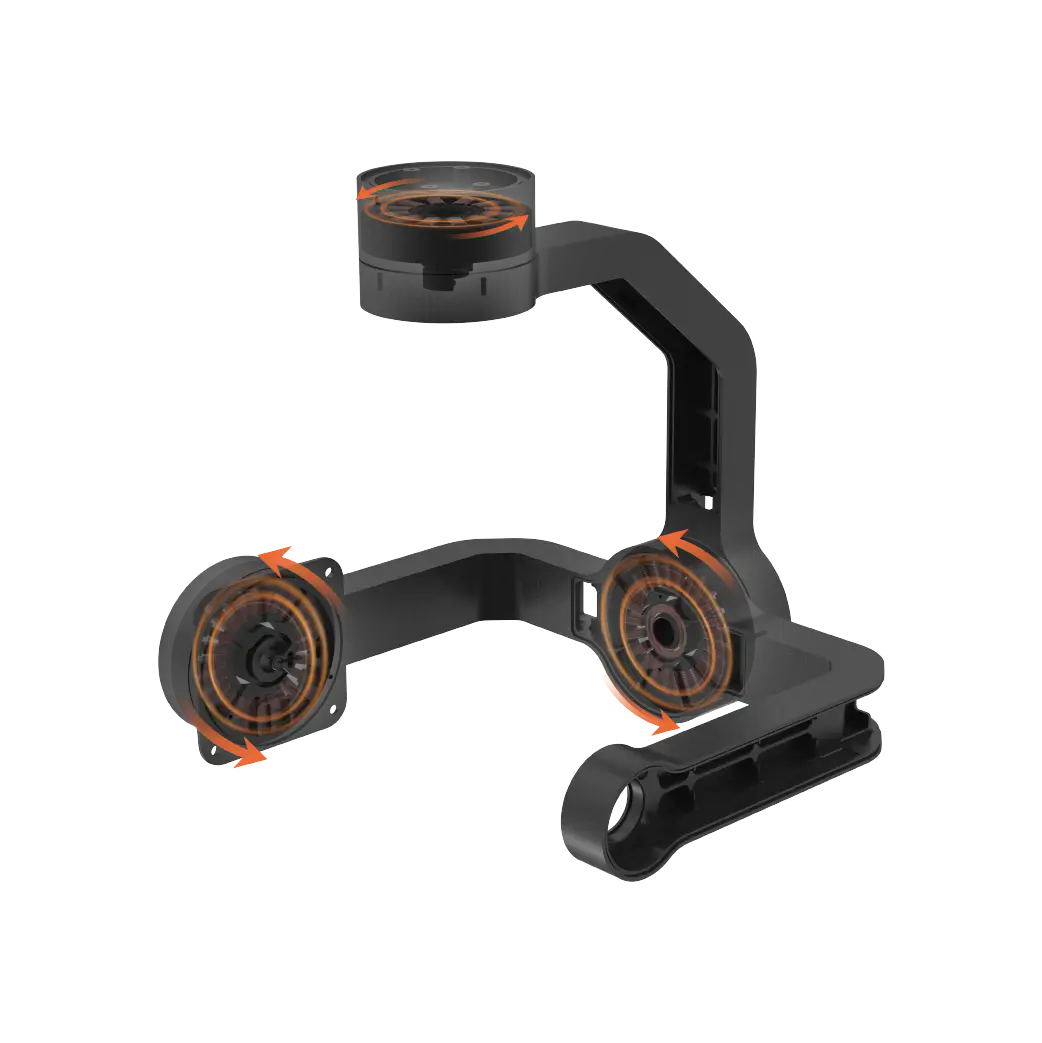
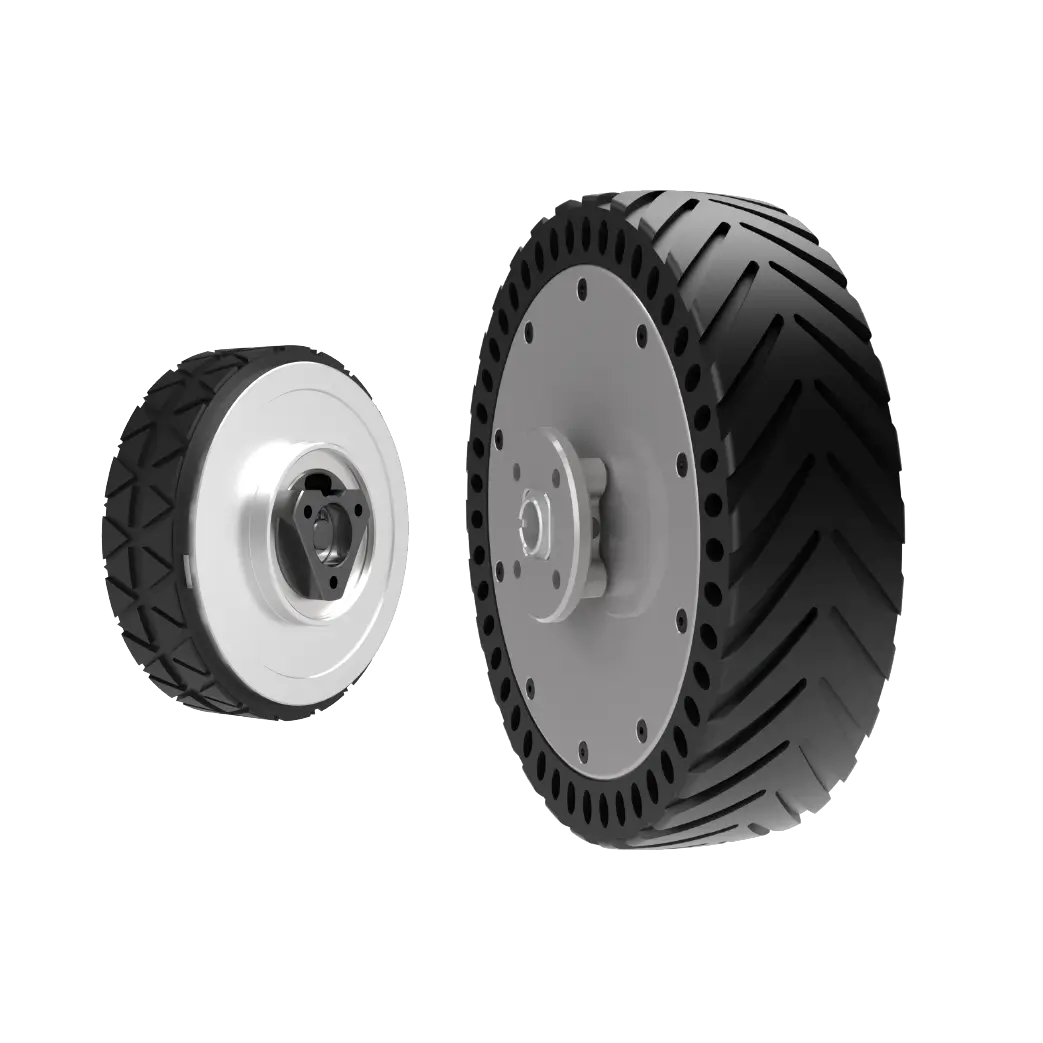
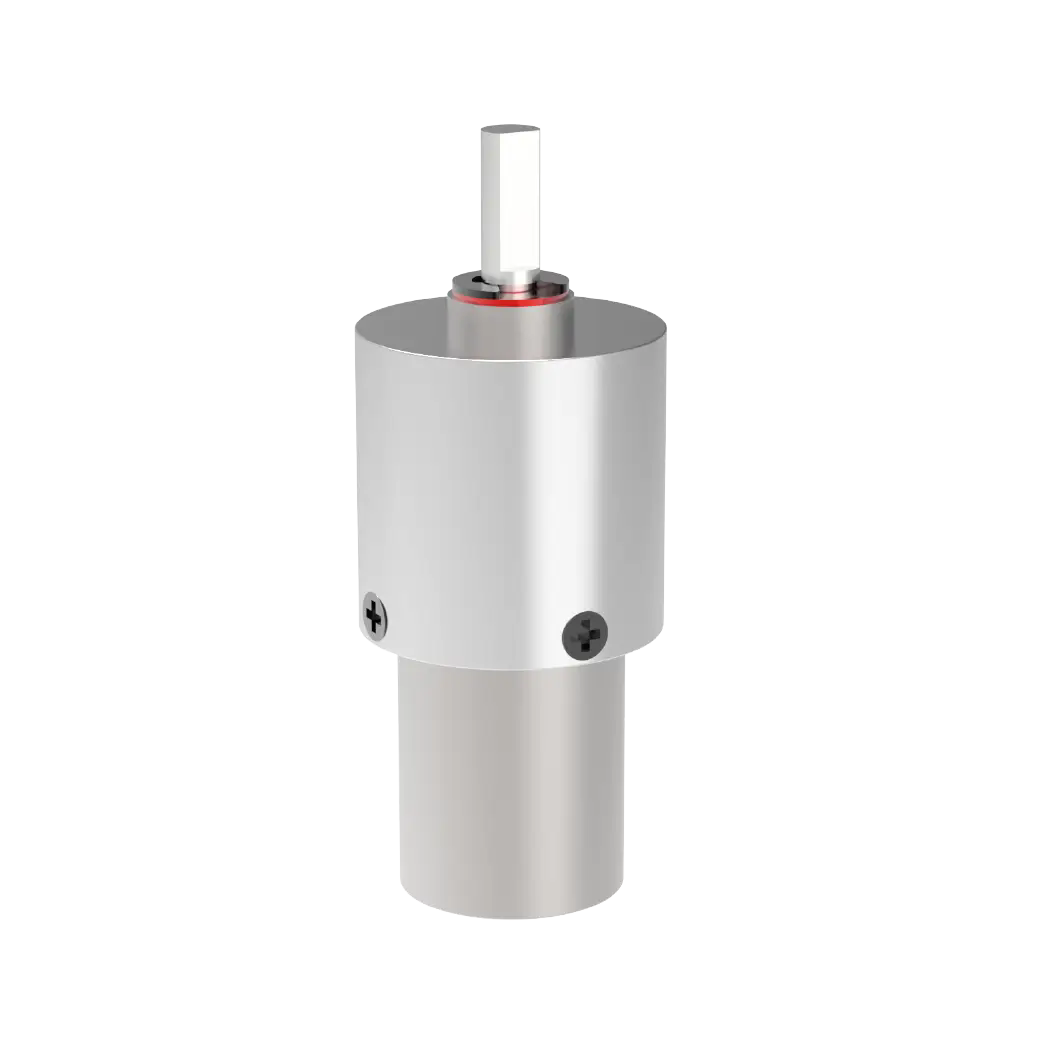
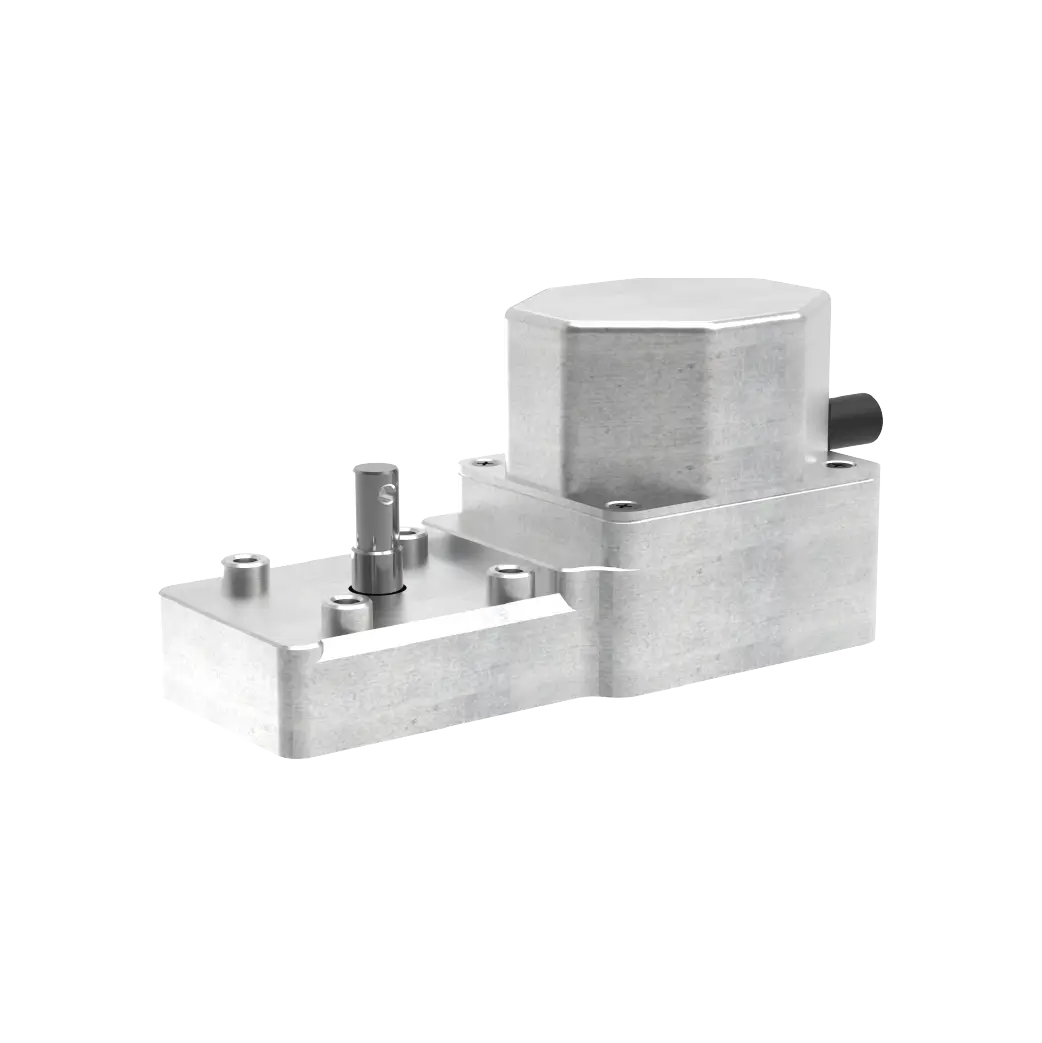
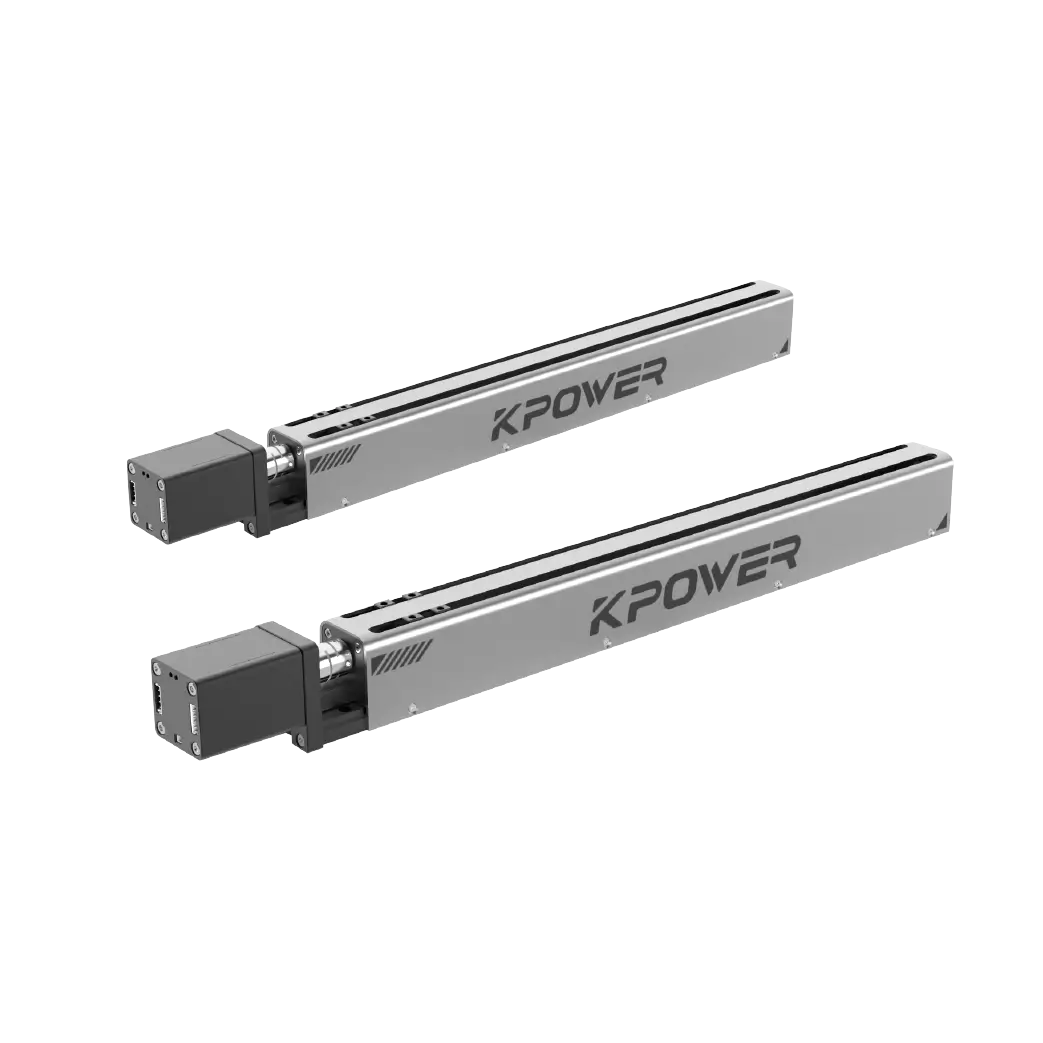
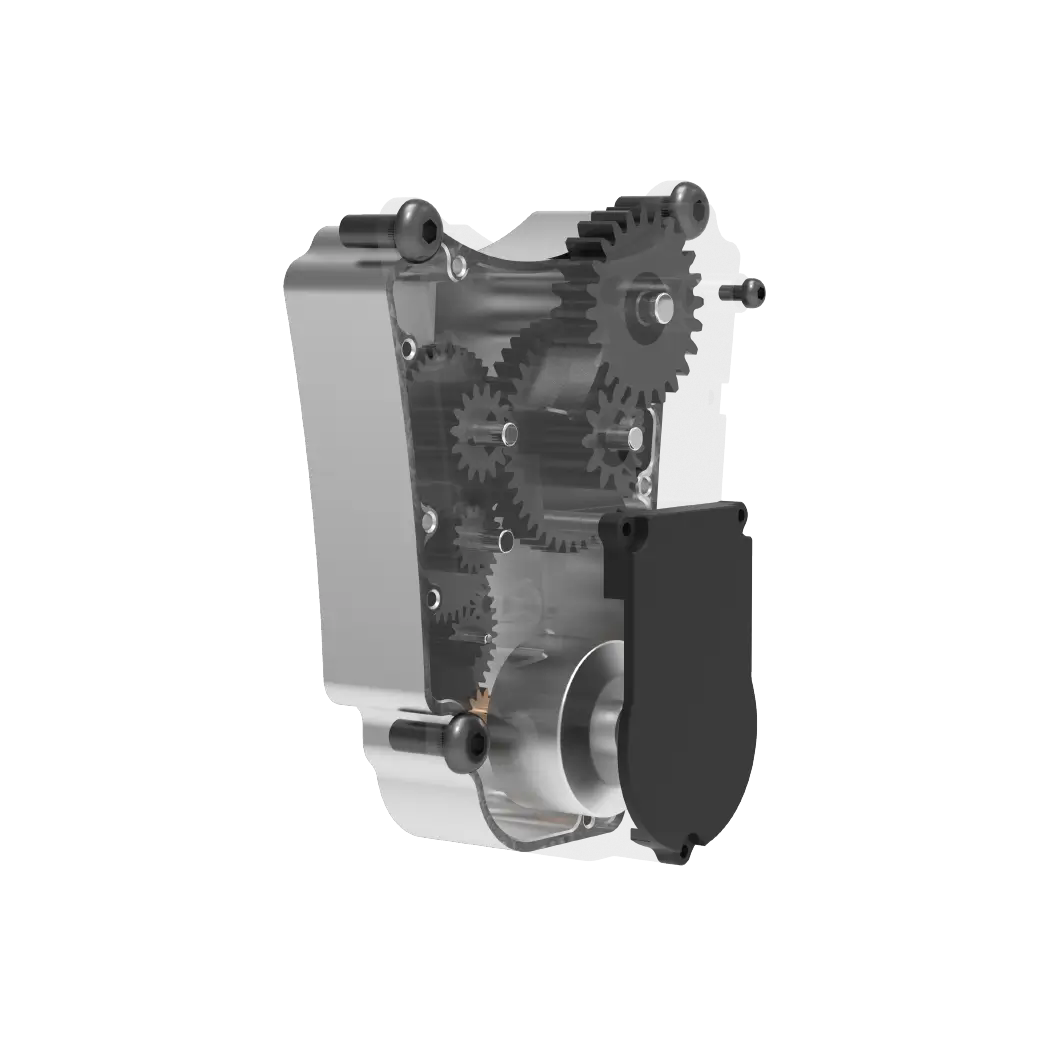
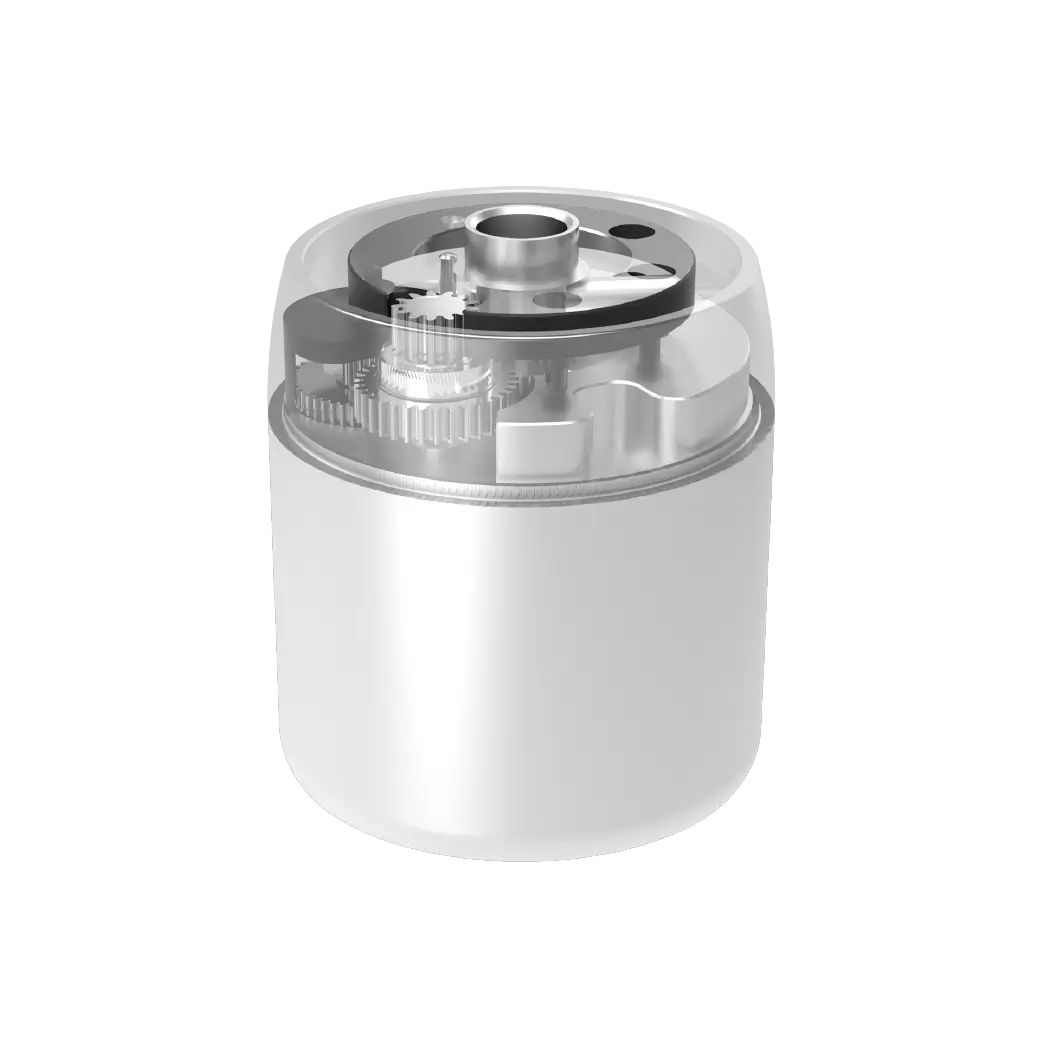
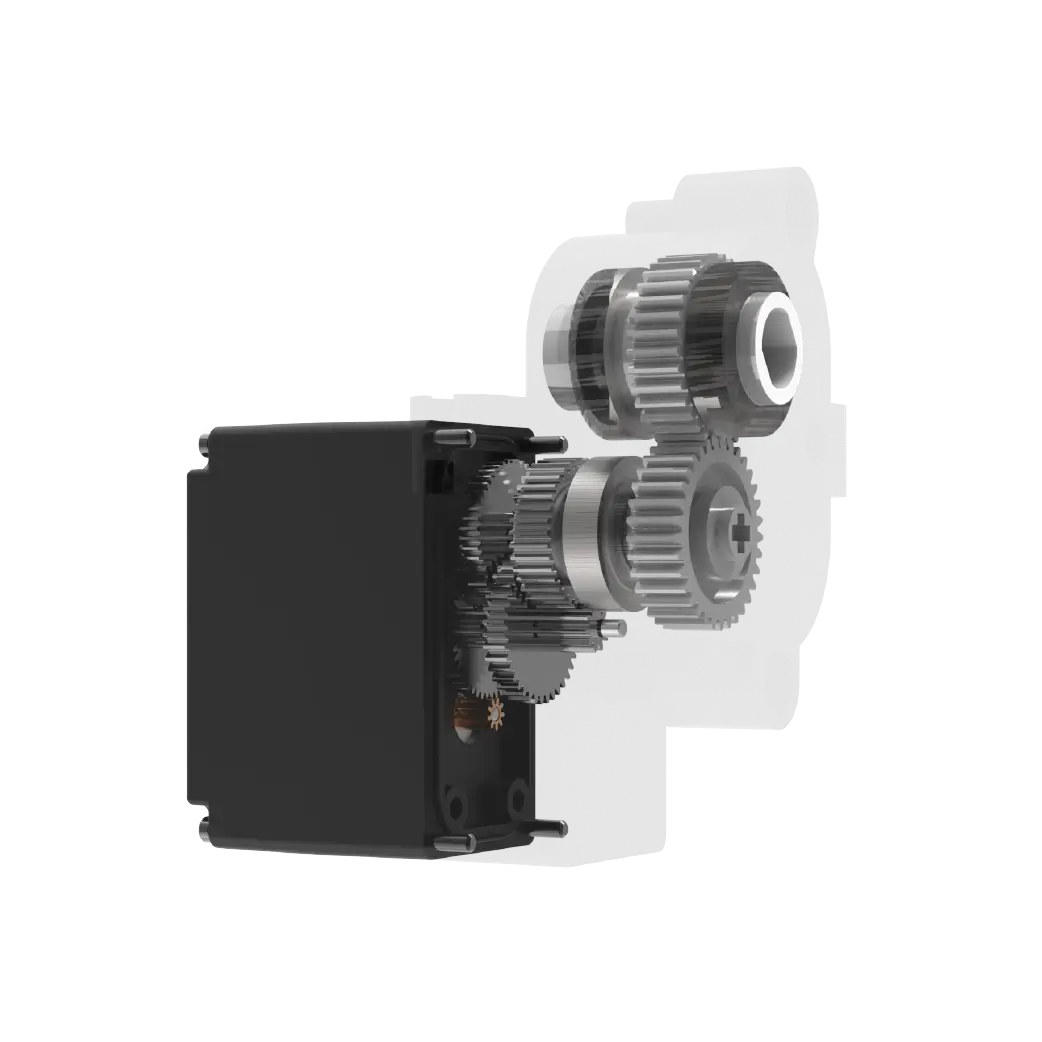
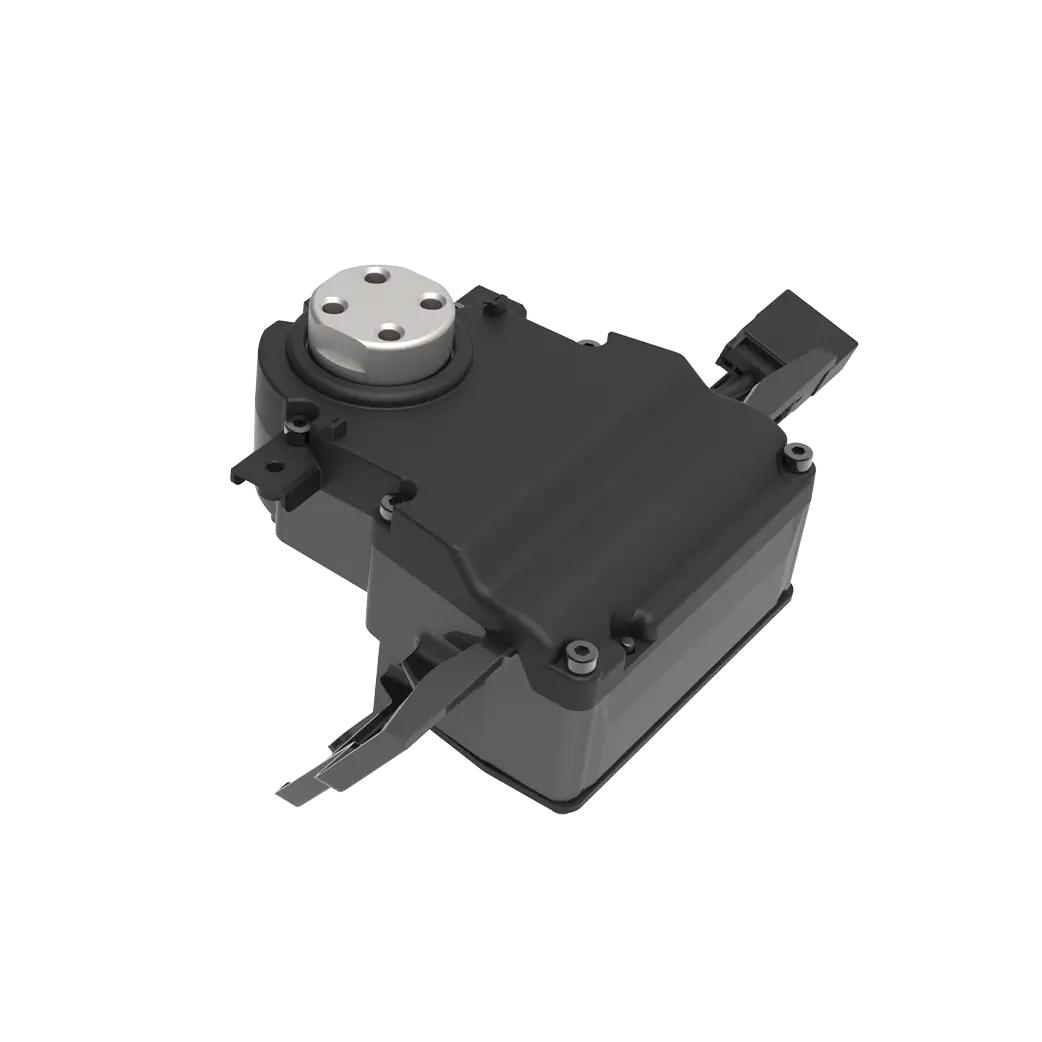
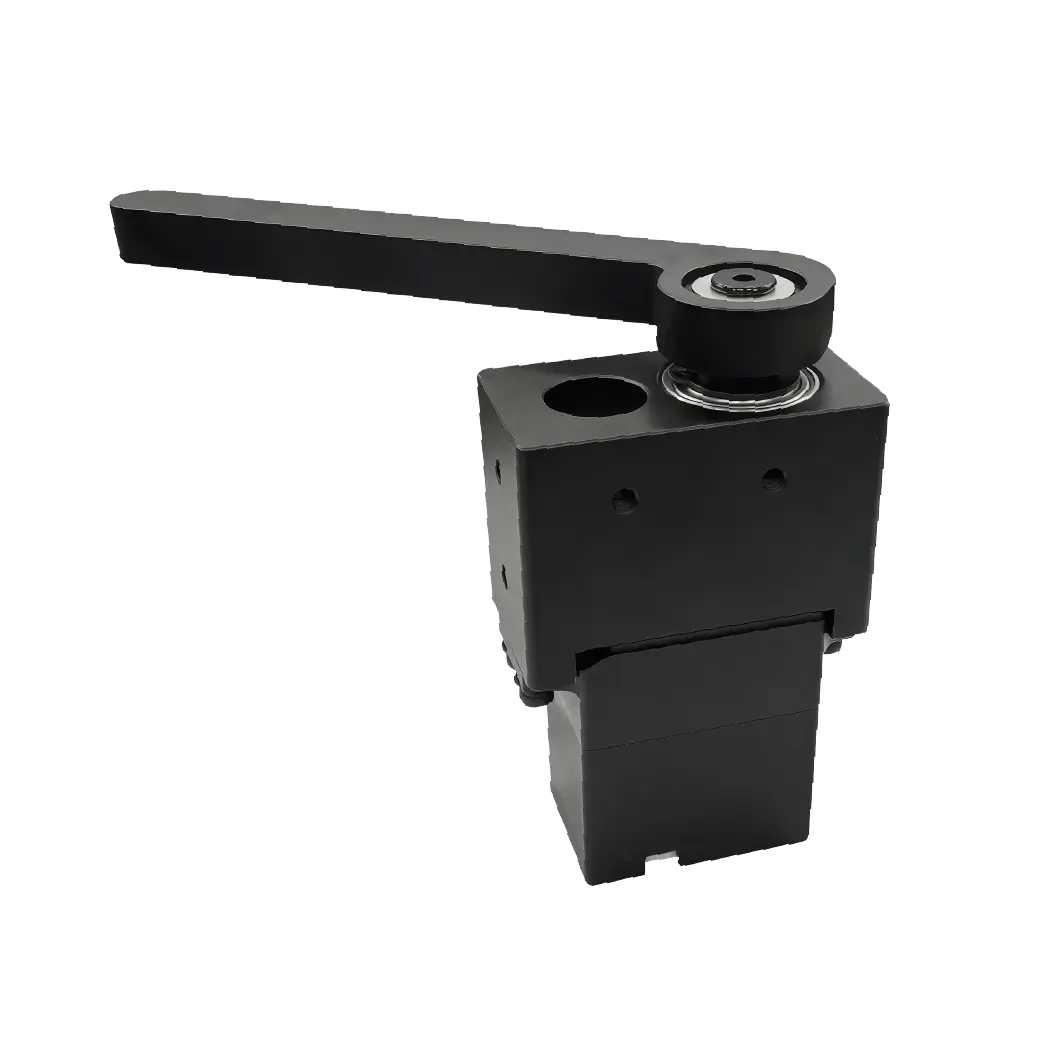
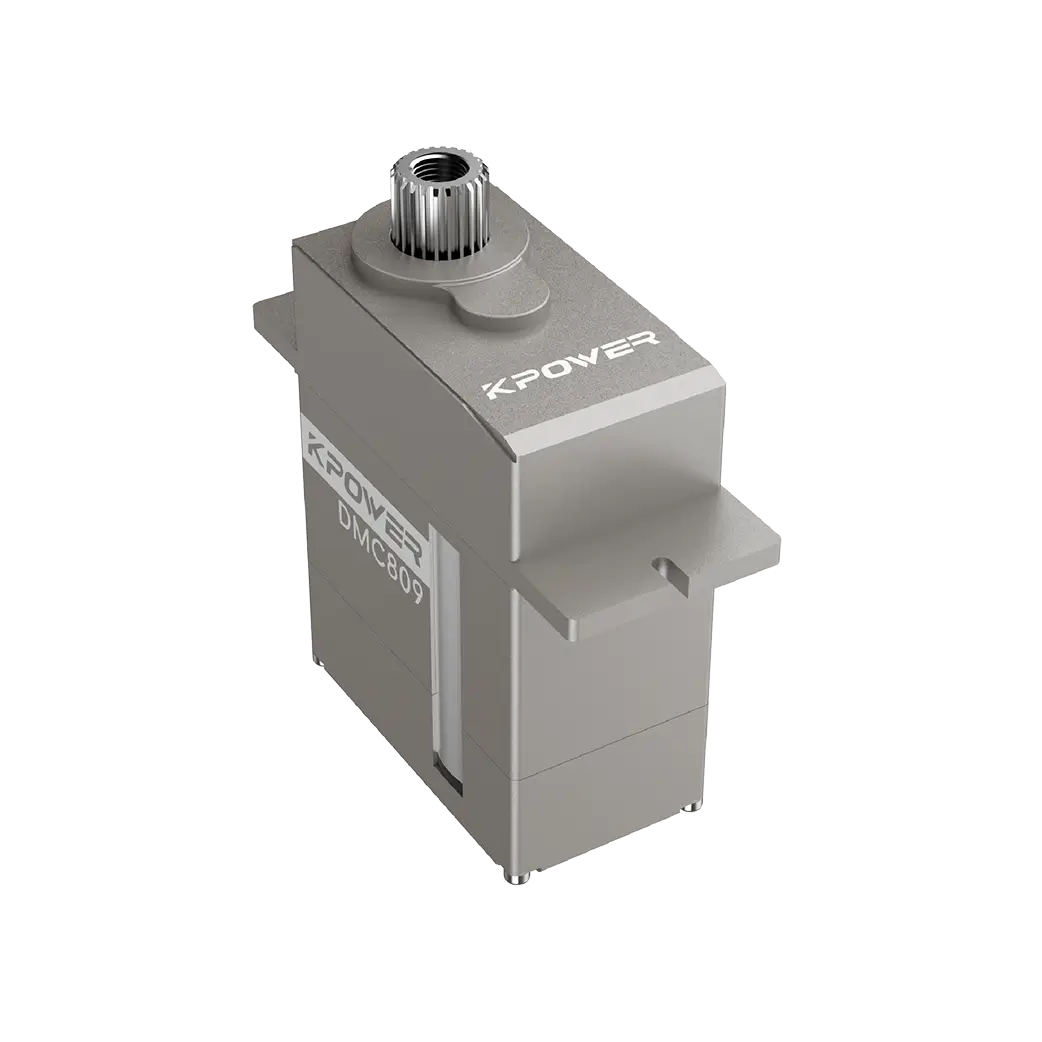
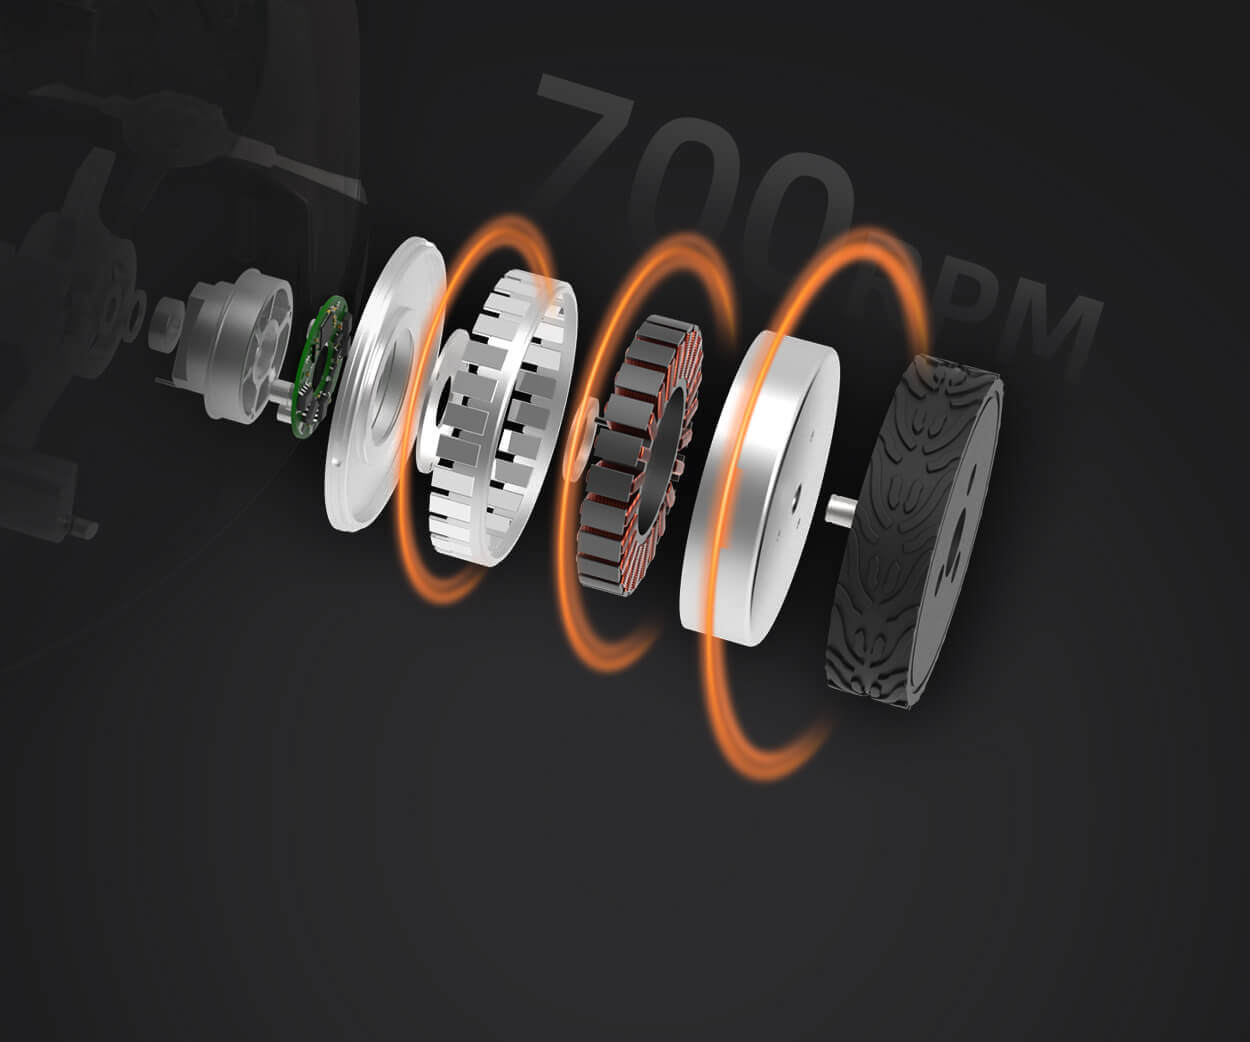
Established in 2005,kpowerhas been dedicated to a professional compact motion unit manufacturer, headquartered in Dongguan, Guangdong Province, China. Leveraging innovations in modular drive technology,kpowerintegrates high-performance motors, precision reducers, and multi-protocol control systems to provide efficient and customized smart drive system solutions.kpowerhas delivered professional drive system solutions to over 500 enterprise clients globally with products covering various fields such as Smart Home Systems, Automatic Electronics, Robotics, Precision Agriculture, Drones, and Industrial Automation.
Update Time:2026-01-19
Contact Kpower's product specialist to recommend suitable motor or gearbox for your product.