


TECHNICAL SUPPORT


Published 2026-01-19
Ever had that moment when you’re tinkering withservomotors or mechanical prototypes and everything’s humming along just fine—until it’s not? One day your microservices are running smoothly, and the next you’re staring at a dashboard full of red alerts, wondering where things went sideways. It’s like a finely tuned machine suddenly losing its rhythm, leaving you scrambling to figure out which gear slipped.
Sounds familiar? That’s because when microservices grow, keeping an eye on every moving part gets messy. You might be tracking performance, debugging communication hiccups, or just trying to stop small issues from snowballing. Without clear visibility, it’s all guesswork. And guesswork doesn’t play nice with tight deadlines or complex setups.
So, how do you keep your digital ecosystem in check without drowning in data?
Enter Cloud Monitoring for Microservices: Not Just Watching, But Understanding
Think of it as giving your system a nervous system—a way to feel what’s happening in real time, from latency spikes to error rates, without digging through logs for hours. A solid monitoring solution doesn’t just collect numbers; it tells a story. It connects the dots between services, traces requests as they travel, and highlights what actually matters.
For teams working withservo-driven designs or automated controls, this kind of clarity is gold. Why? Because whether you’re dealing with physical mechanics or software architectures, the principles are similar: precision, reliability, and timely feedback matter. If aservomotor misses a signal, the whole motion sequence can falter. Similarly, if one microservice lags, it can ripple through your entire application.
But here’s a question worth pondering: What makes a monitoring tool truly useful? Is it flashy graphs, or something deeper?
Cut Through the Noise: What to Look For
First, it should be intuitive—no PhD required to navigate. Ever used a tool that feels like operating an aircraft dashboard? Not fun. The best tools feel like a natural extension of your workflow, serving up insights without the clutter.
Second, it needs context. Seeing that CPU usage spiked is one thing; knowing which service caused it, why, and what to do next is another. Good monitoring ties metrics to real actions, so you’re not left guessing.
Third, it has to be proactive. Waiting for alerts is like noticing a strange noise in your motor only after it’s gotten worse. By then, you might already be facing downtime. Observability that spots trends and subtle shifts helps you act before things break.
And let’s talk compatibility. Your setup is unique—maybe a mix of legacy code, new services, and custom integrations. The right solution shouldn’t force you to rebuild everything. It should slide into your environment, adapting to how you work instead of the other way around.
From Chaos to Calm: A Day in the Life with Better Monitoring
Imagine starting your morning with a clear snapshot of how everything ran overnight. No surprises, no fire drills—just a straightforward view of performance trends, slow endpoints, and resource usage. You notice an unusual pattern in one service, drill down with a couple of clicks, and spot a memory leak in a recent update. Fixed before users even notice.
That’s the difference between reactive and smooth sailing. It turns “What’s broken?” into “Here’s what we can improve.”
This isn’t just about avoiding outages. It’s about creating space to innovate. When you’re not constantly putting out fires, you can focus on refining logic, optimizing responses, or experimenting with new features. Your system becomes more resilient, and your team gains confidence.
Some might wonder: Is this only for large-scale setups? Not really. Even smaller projects benefit from clarity. Think of it like tuning a mechanical assembly—you adjust one component, and the whole operation runs smoother. Visibility helps at any scale.
Whykpower’s Approach Feels Different
Over the years,kpowerhas focused on building tools that mirror how engineers and creators actually think. The goal isn’t to overwhelm with features, but to deliver clarity where it’s needed most. Their cloud monitoring for microservices is designed to feel less like a separate tool and more like a trusted partner—one that speaks your language, understands your priorities, and stays out of the way until you need it.
It’s built for those who appreciate the elegance of a well-designed servo mechanism or the satisfaction of a precise mechanical movement. Because at the end of the day, whether you’re orchestrating hardware or software, you want things to just work—reliably, predictably, and without unnecessary complexity.
So, if you’ve ever felt lost in the fog of metrics, or spent too much time troubleshooting instead of building, maybe it’s time to try a different view. Sometimes, all it takes is the right lens to turn chaos into a clear path forward.
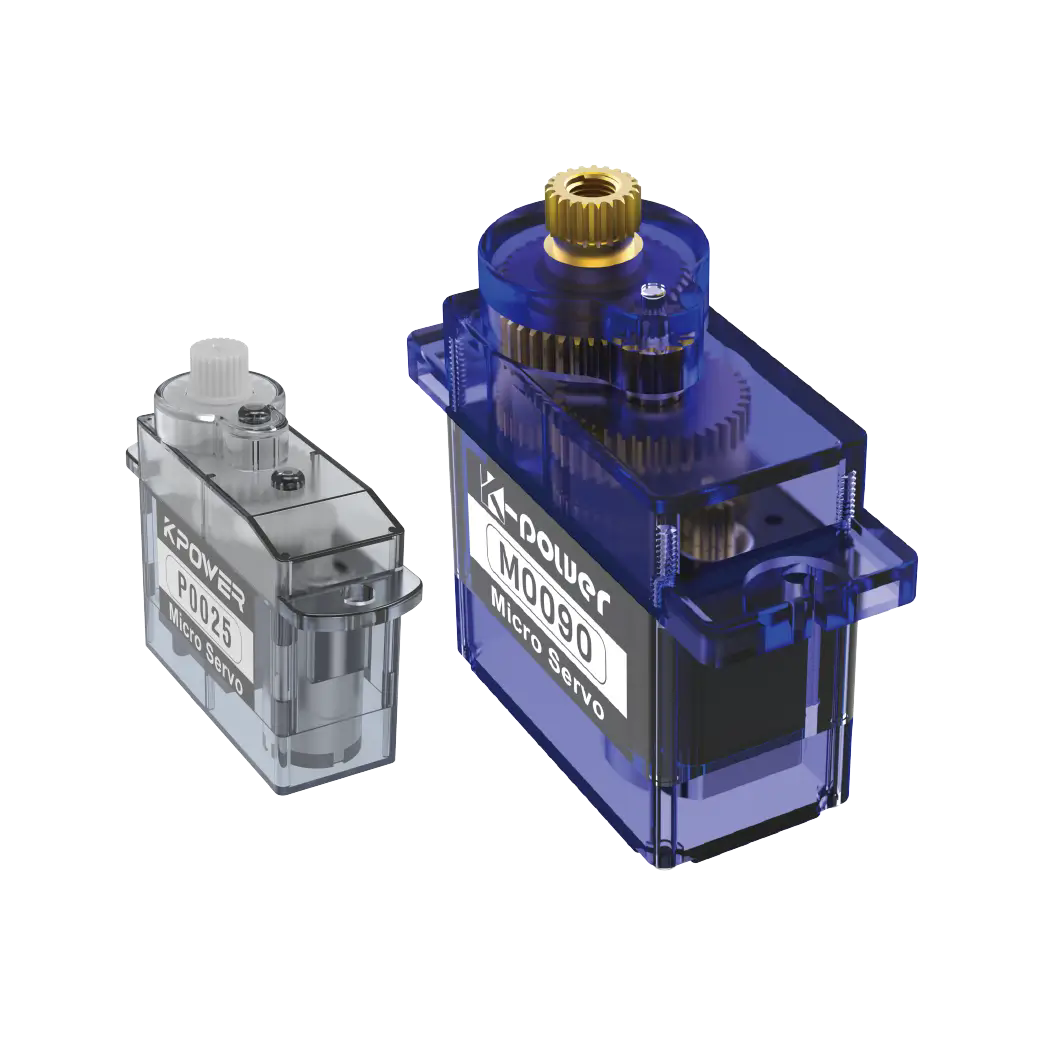
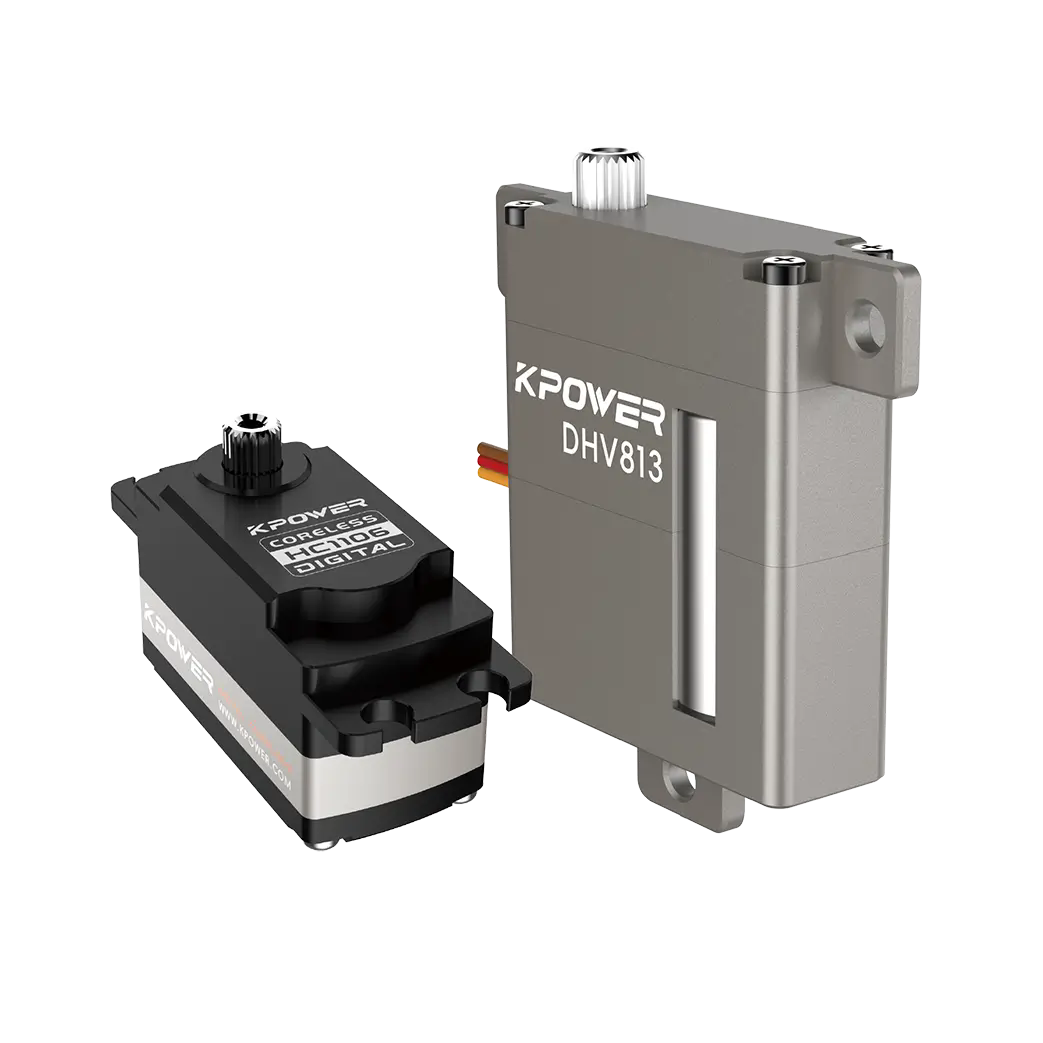
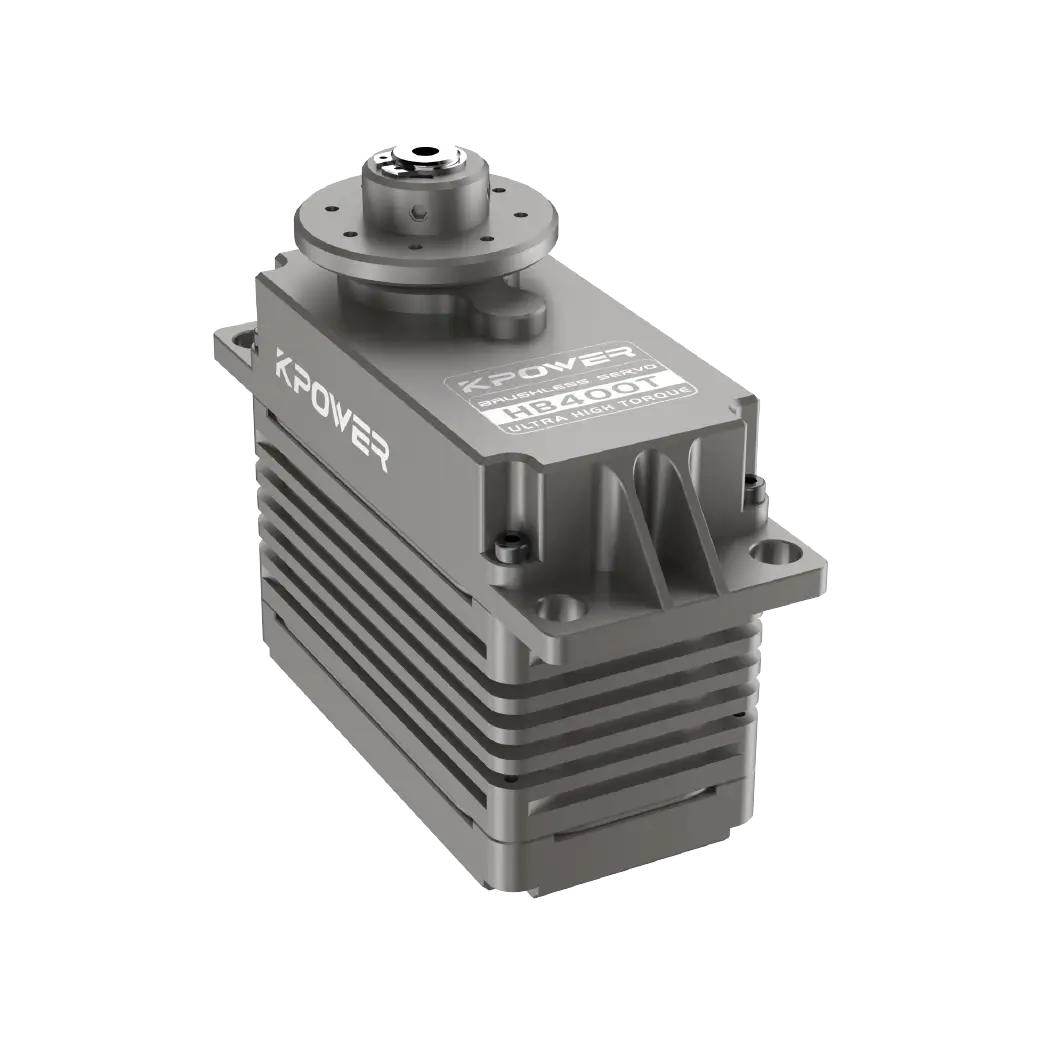
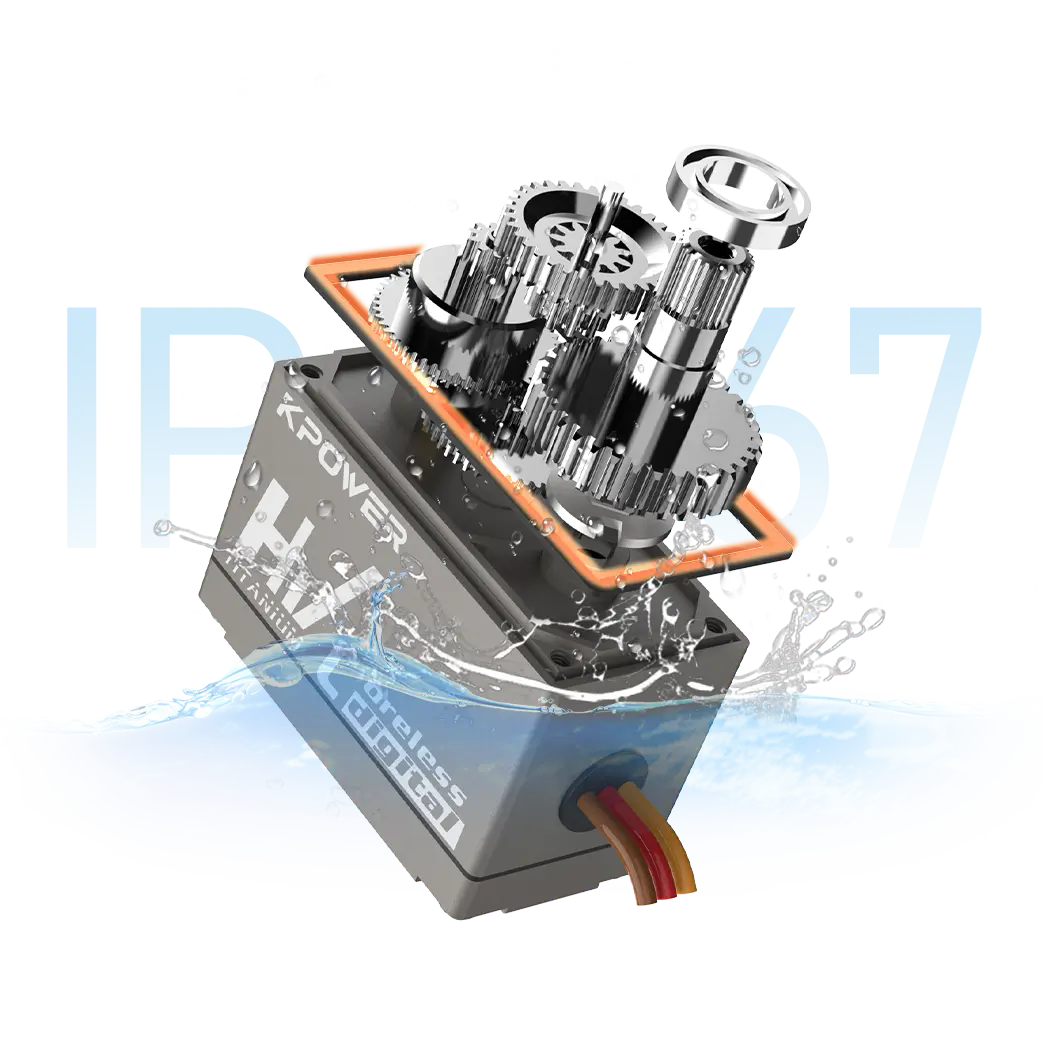
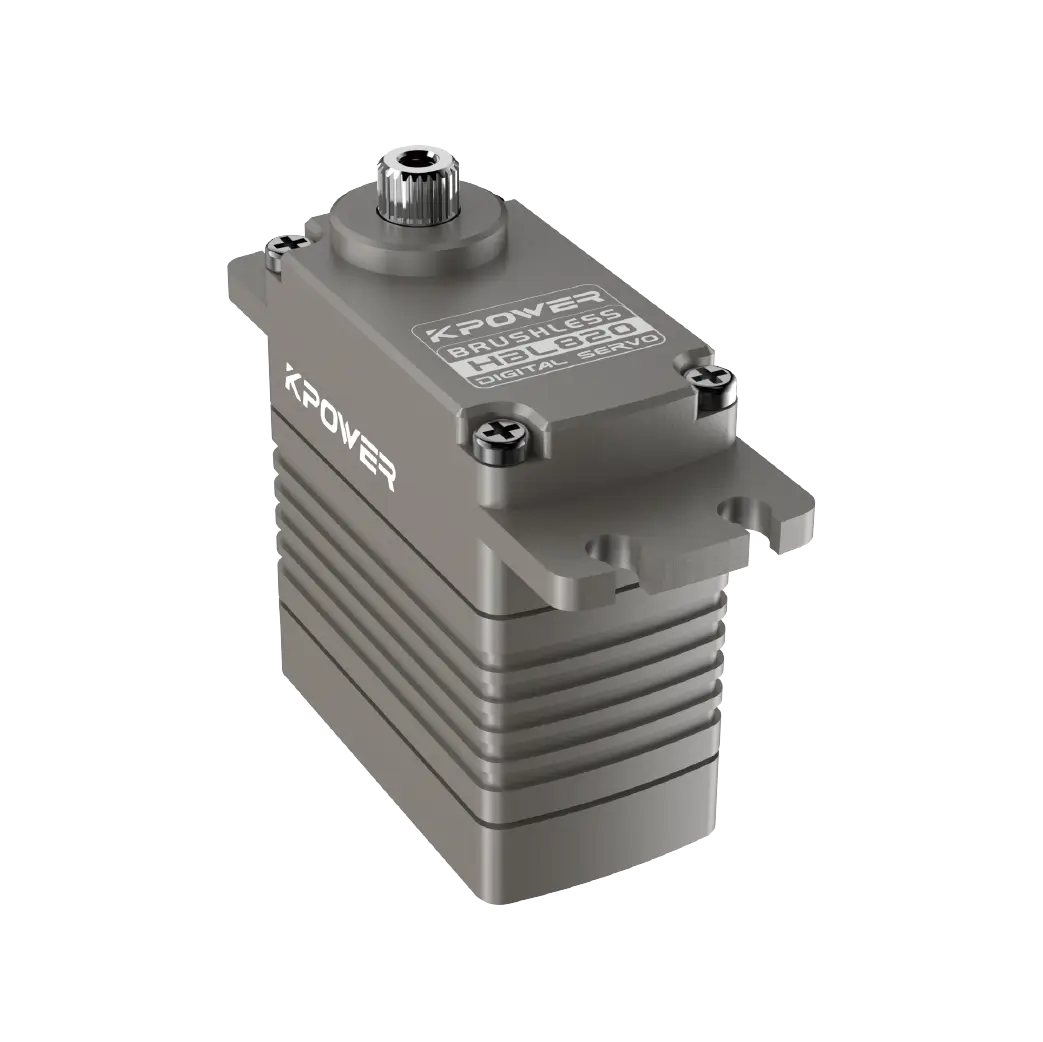
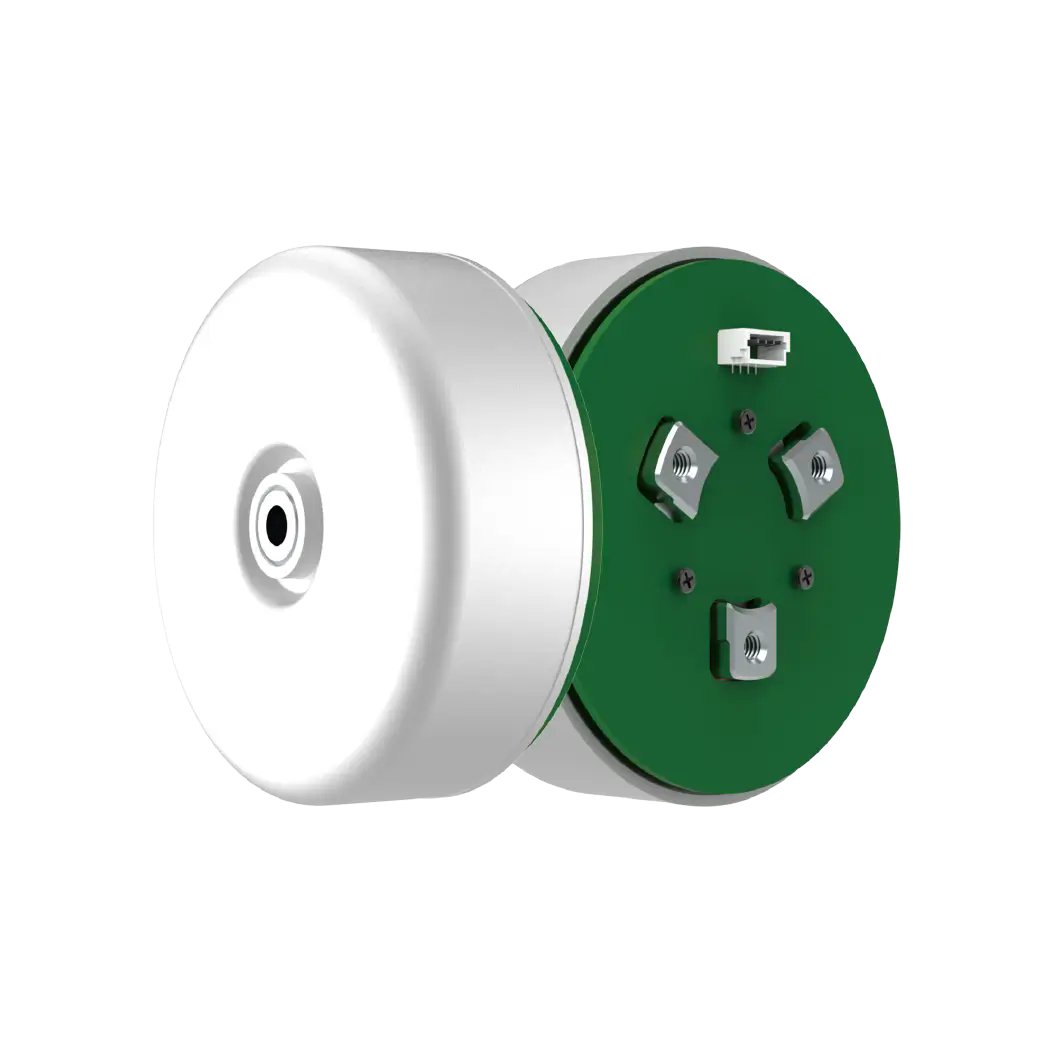
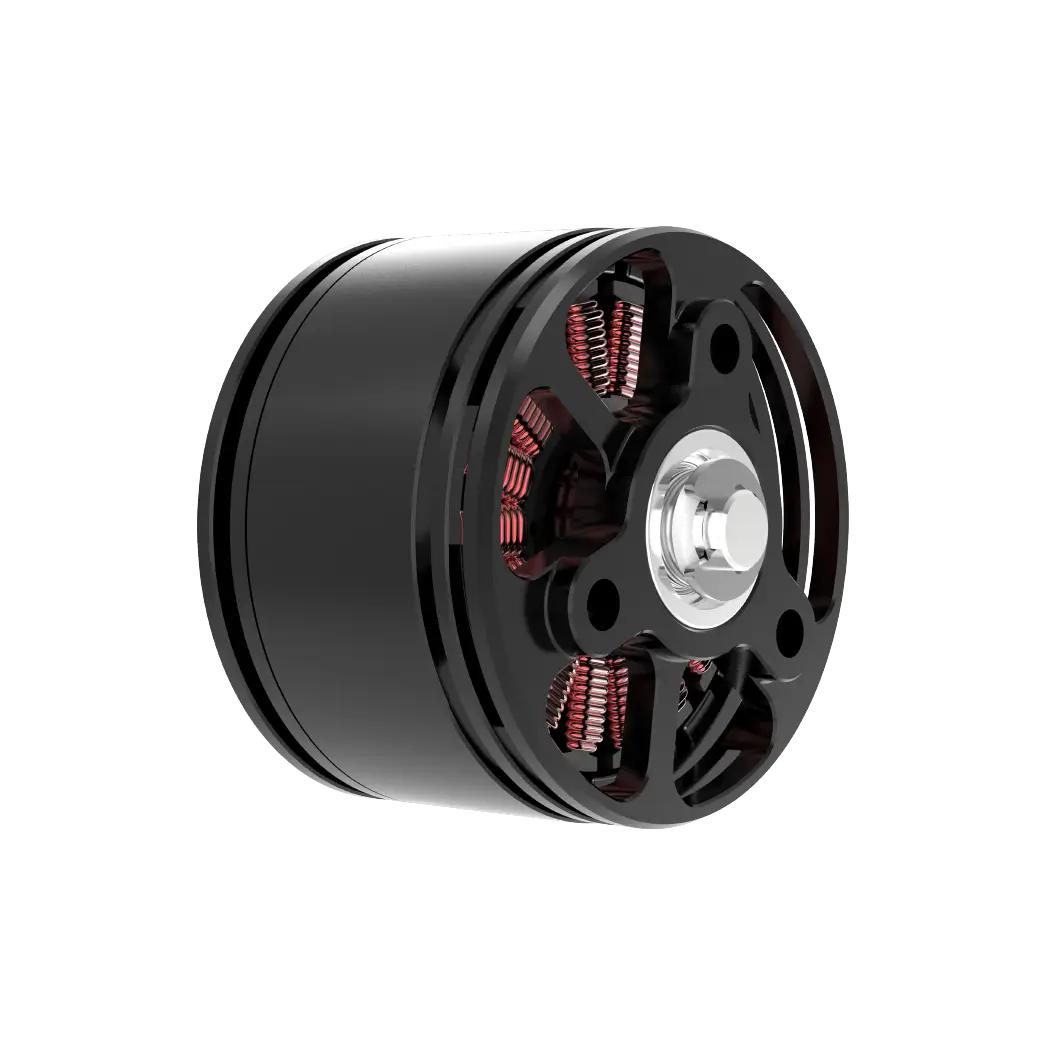
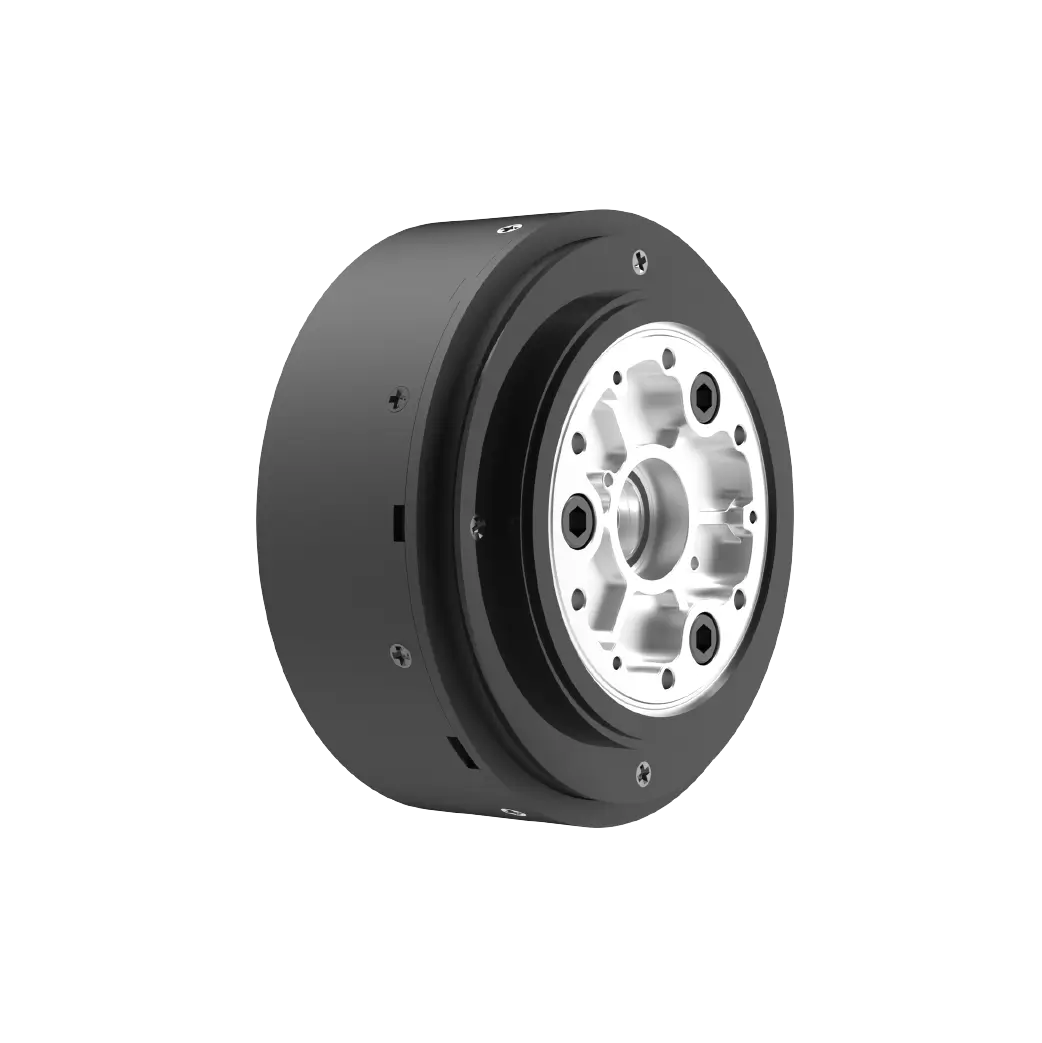
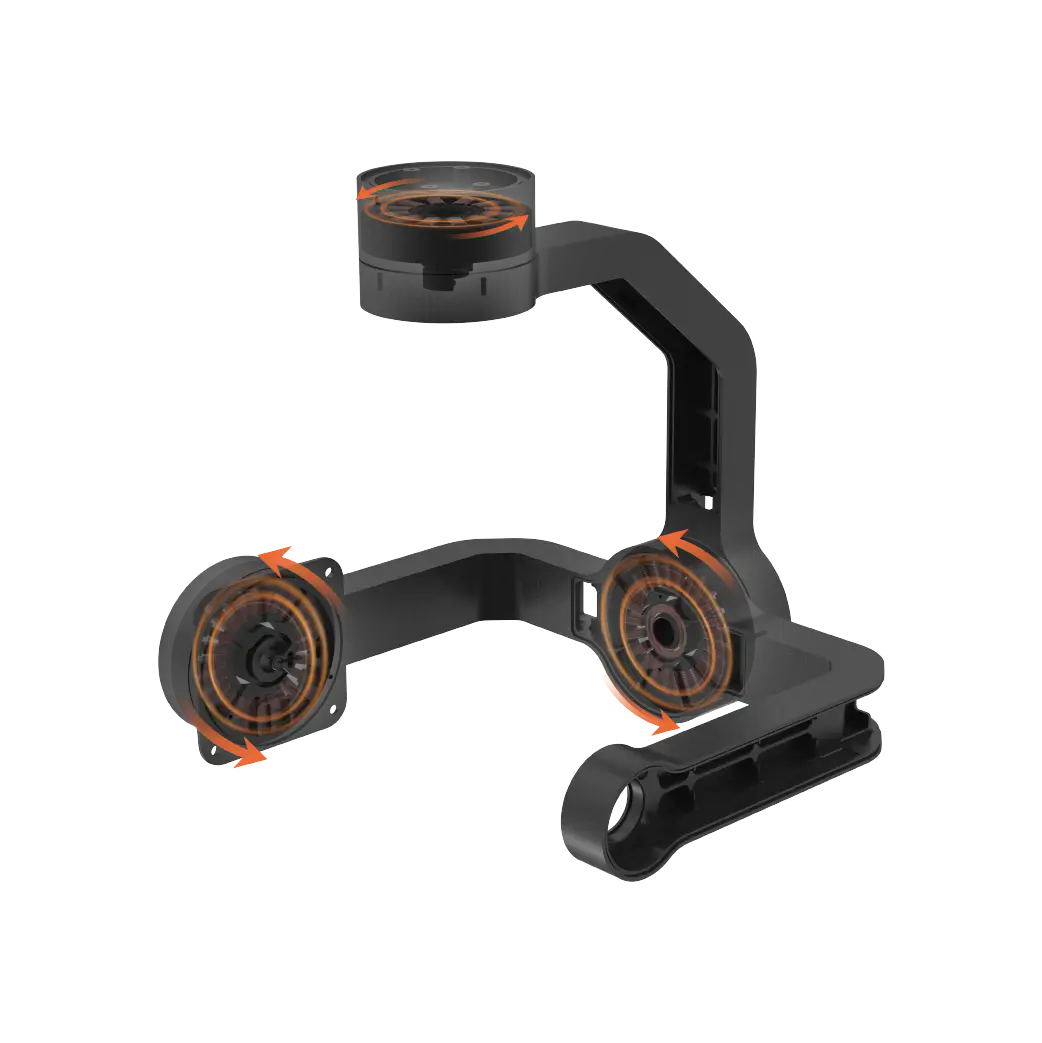
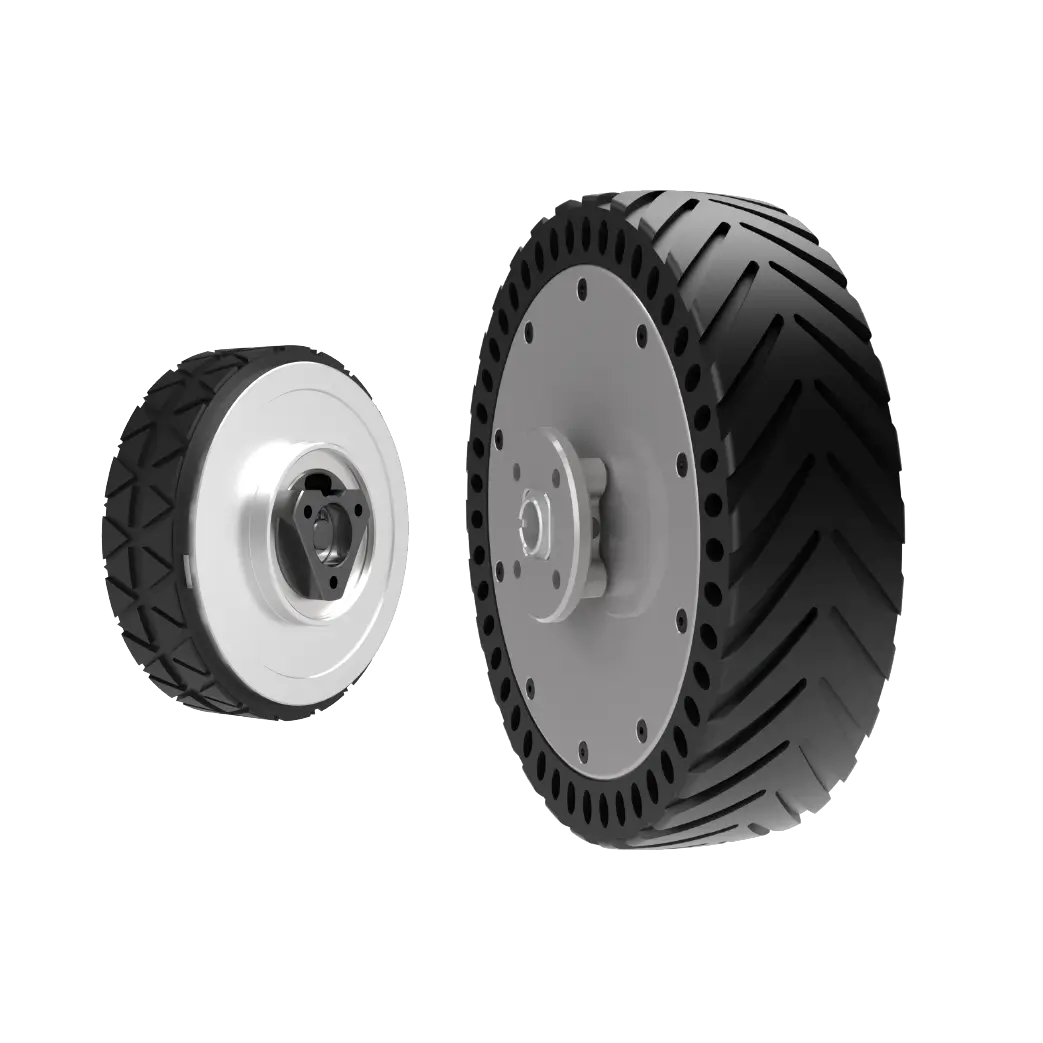
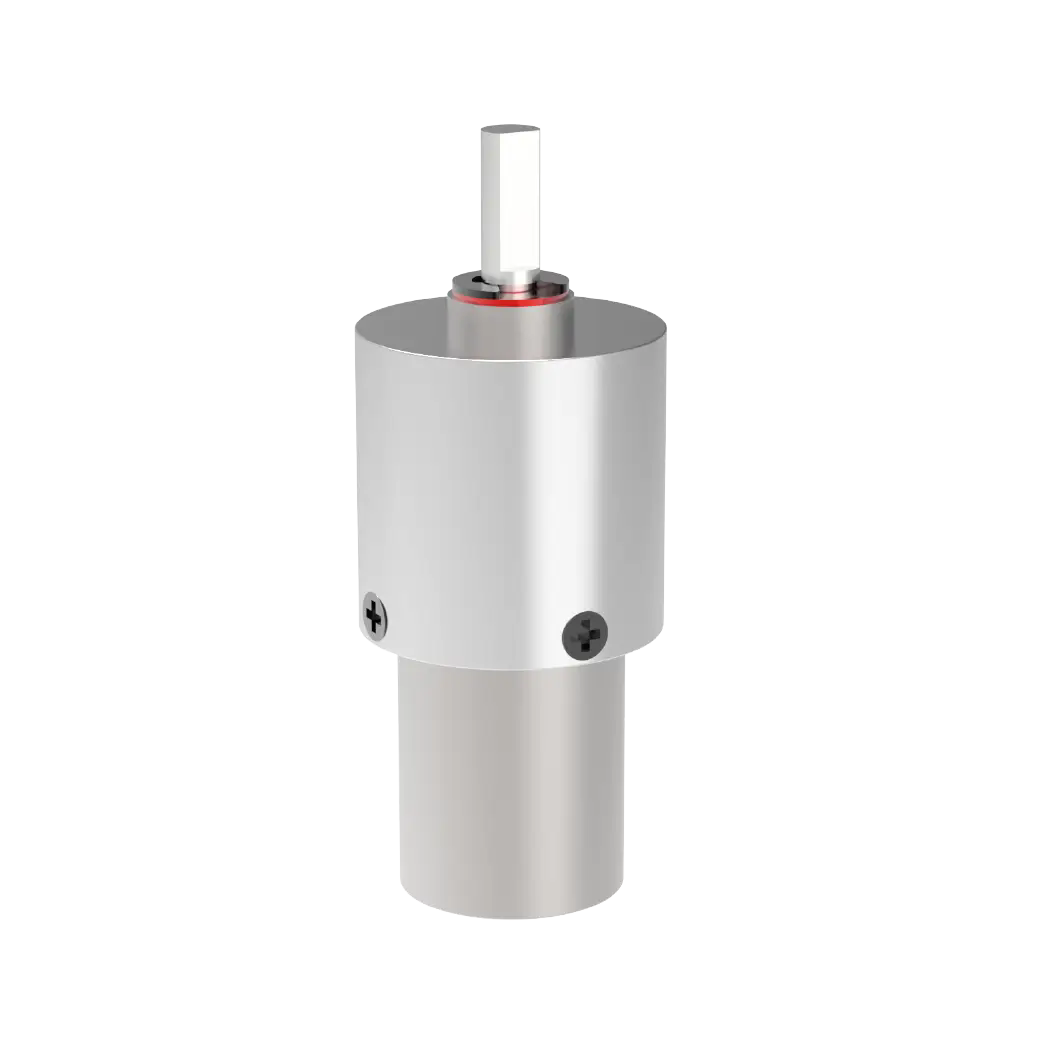
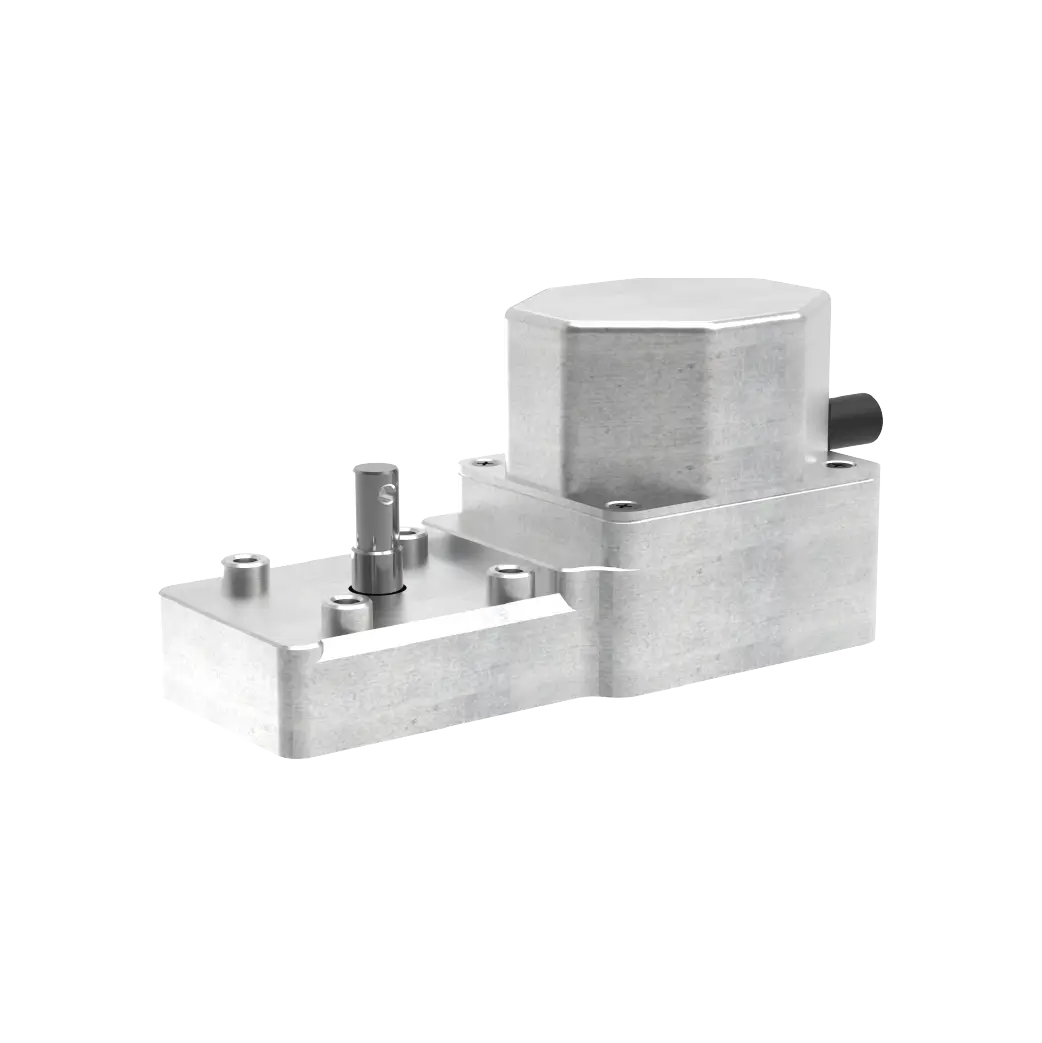
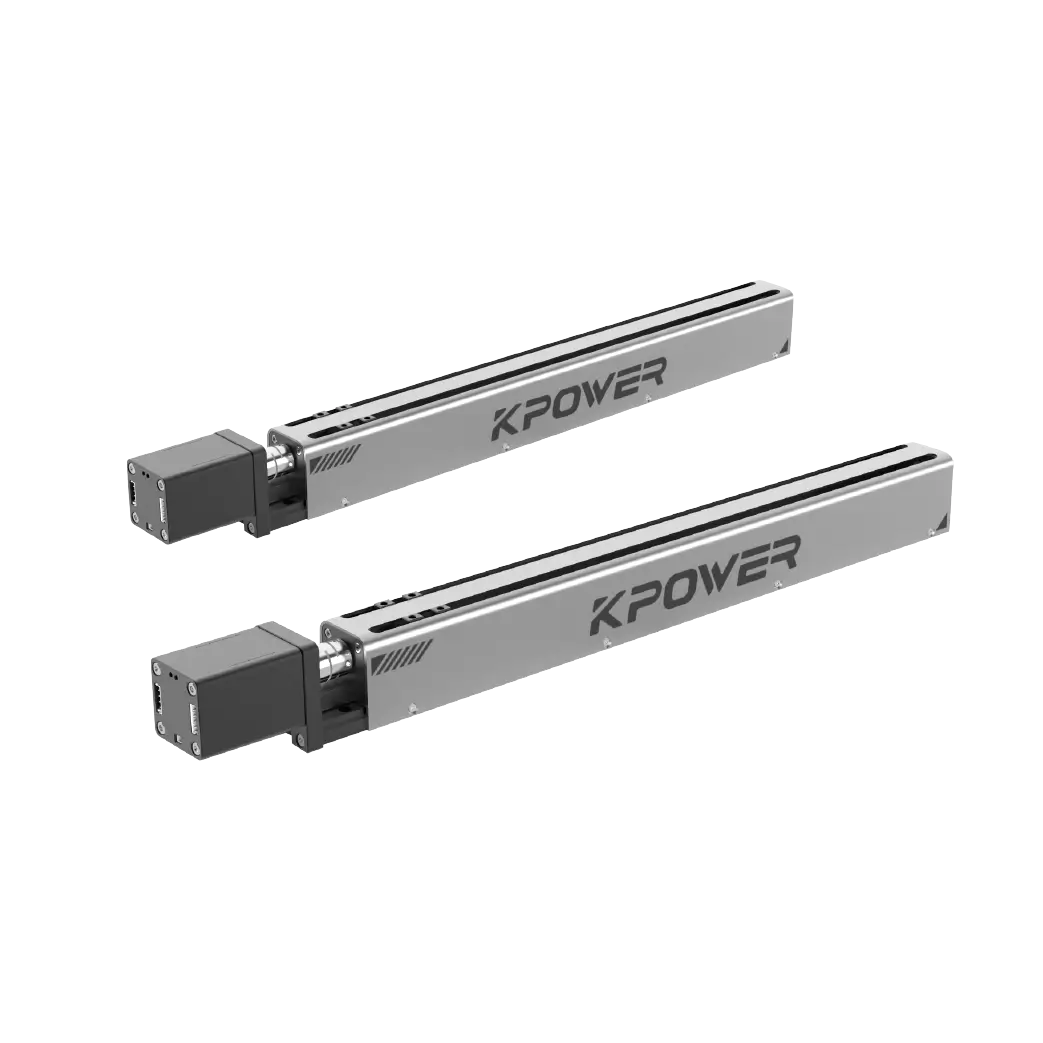
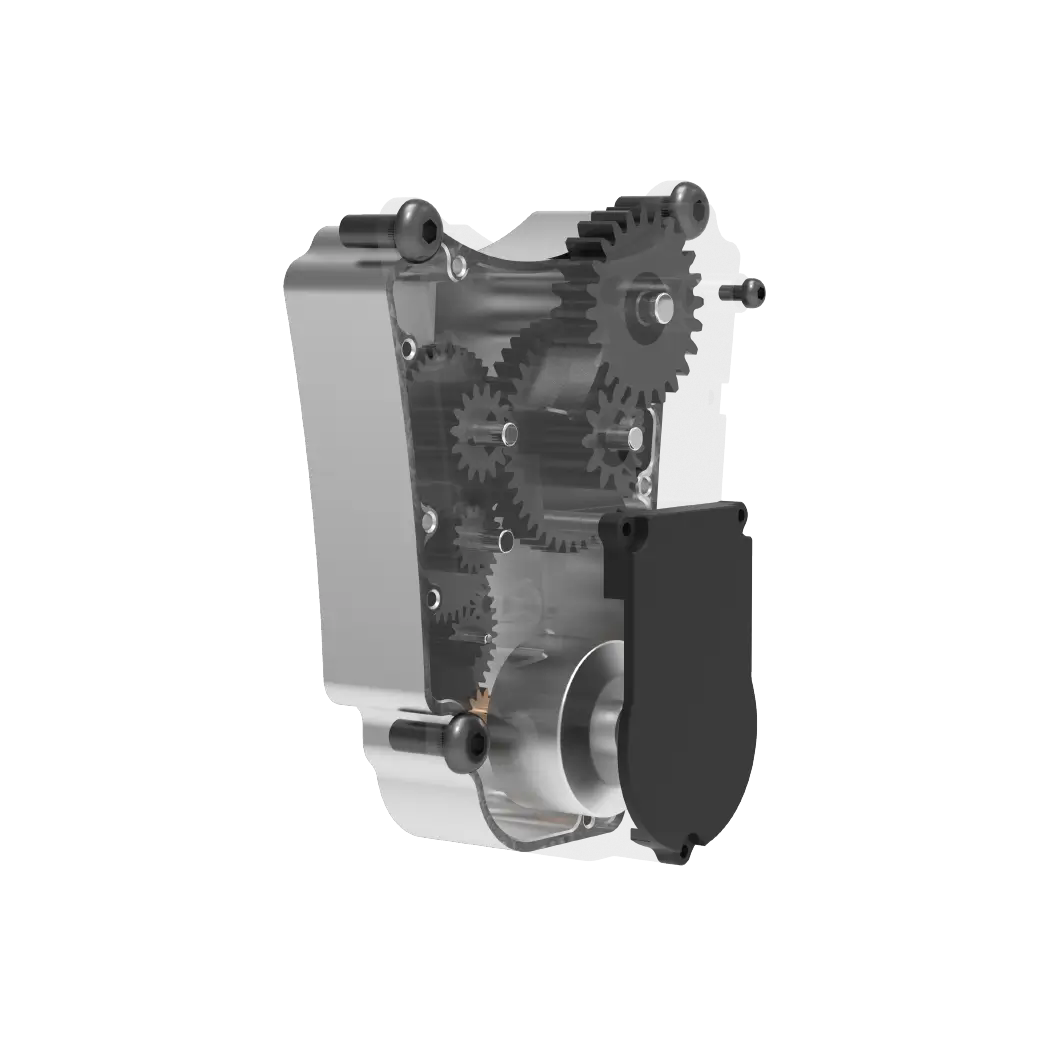
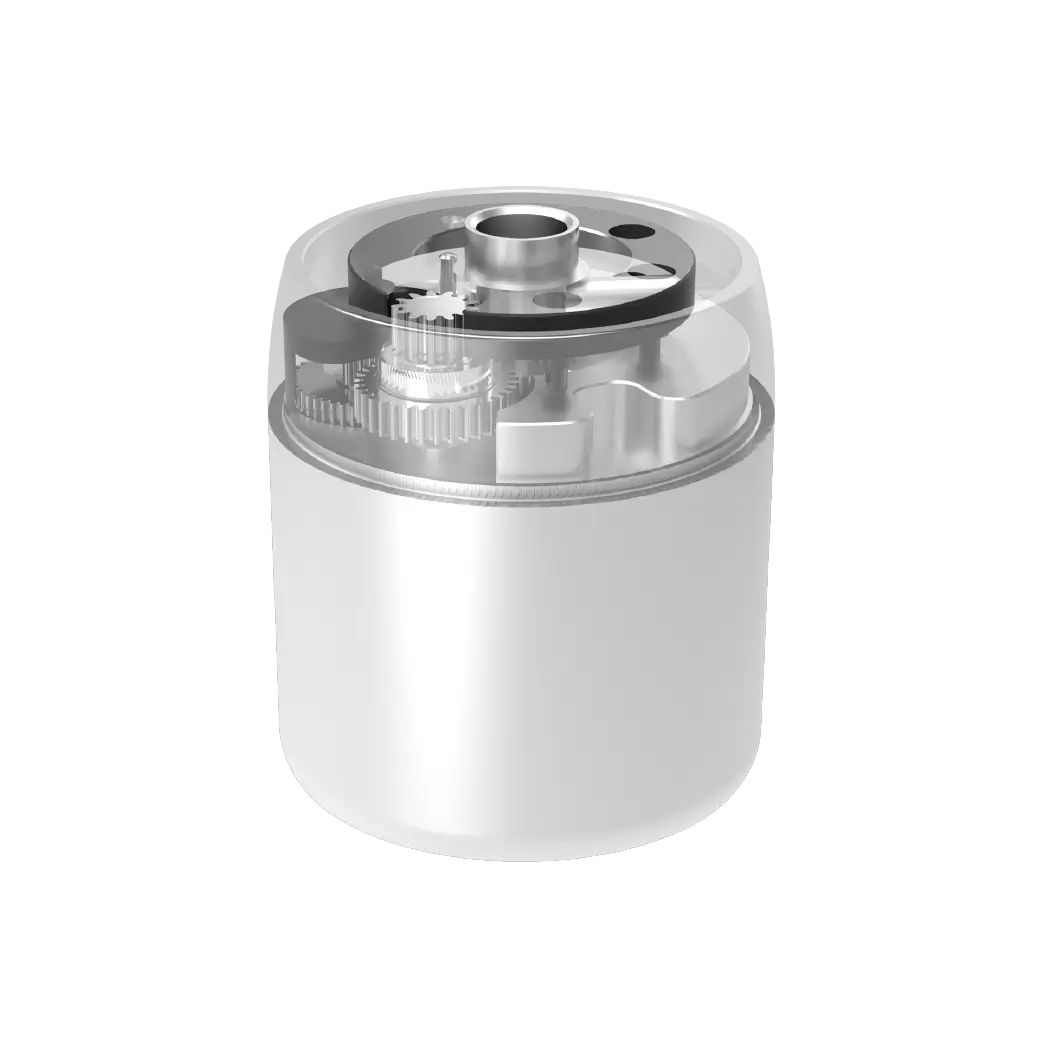
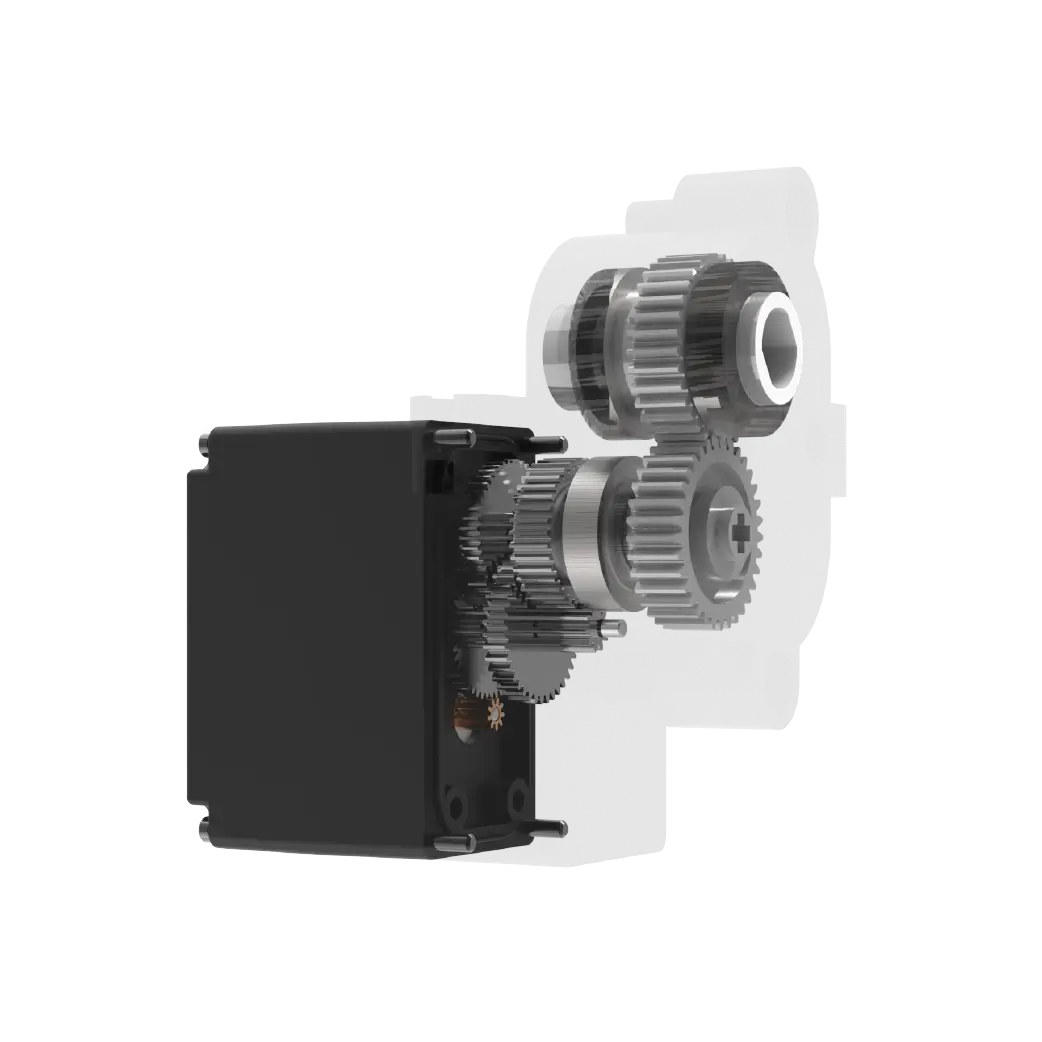
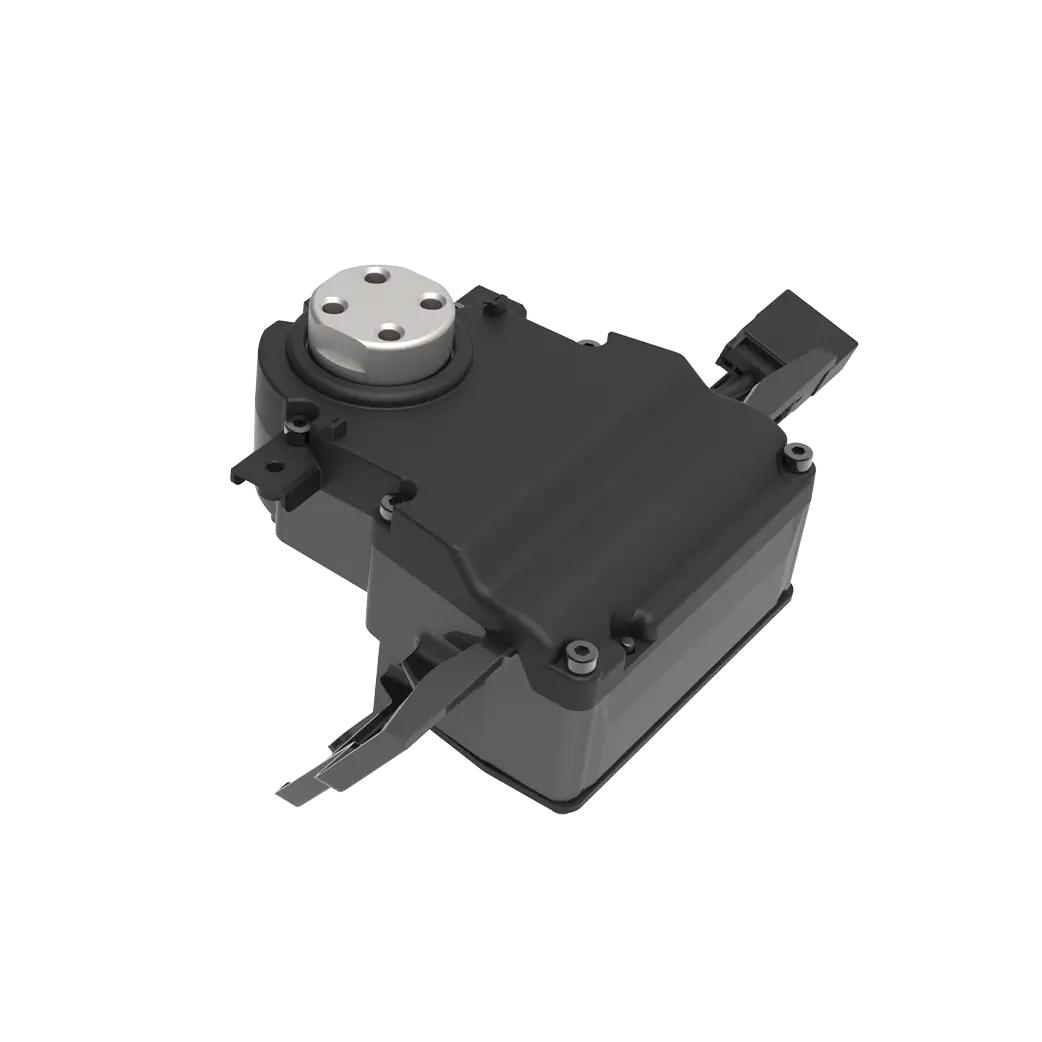
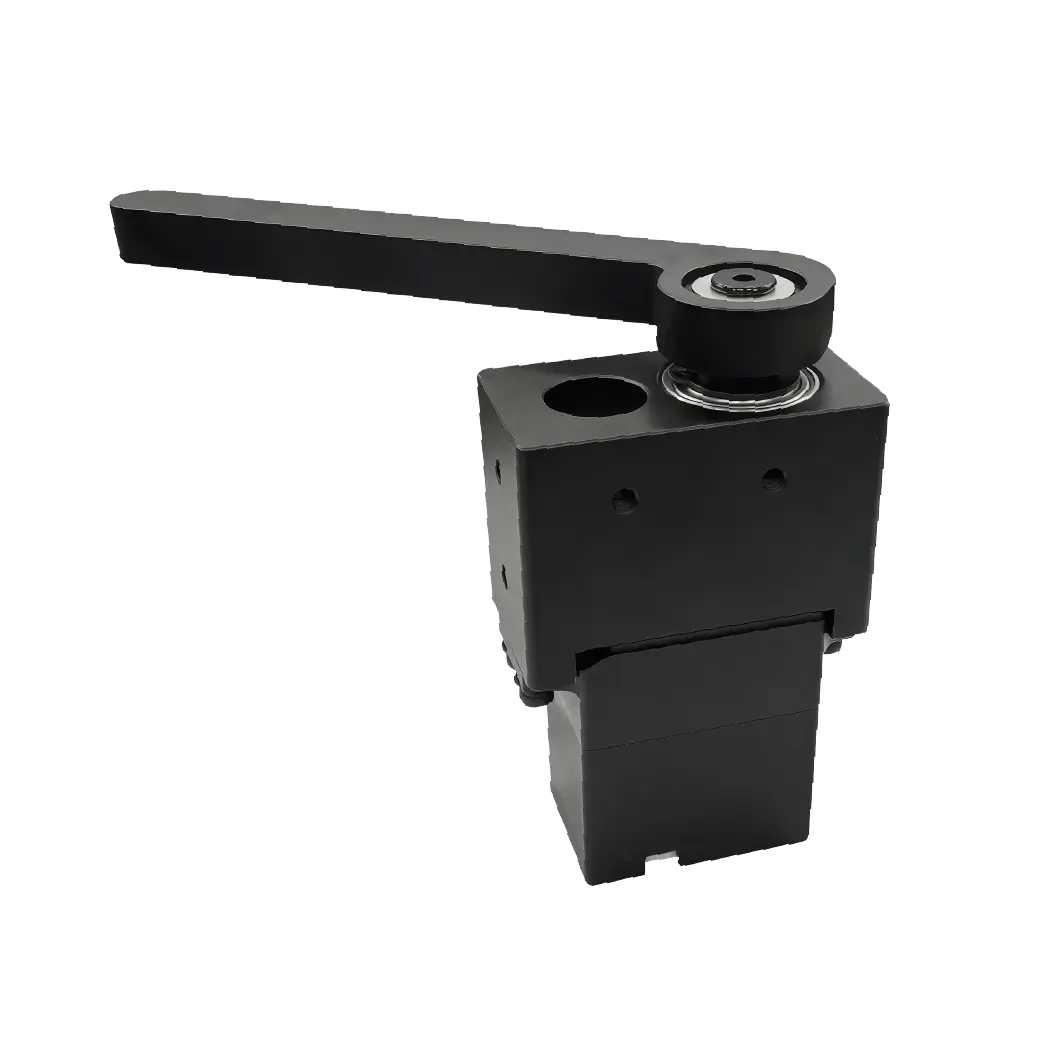
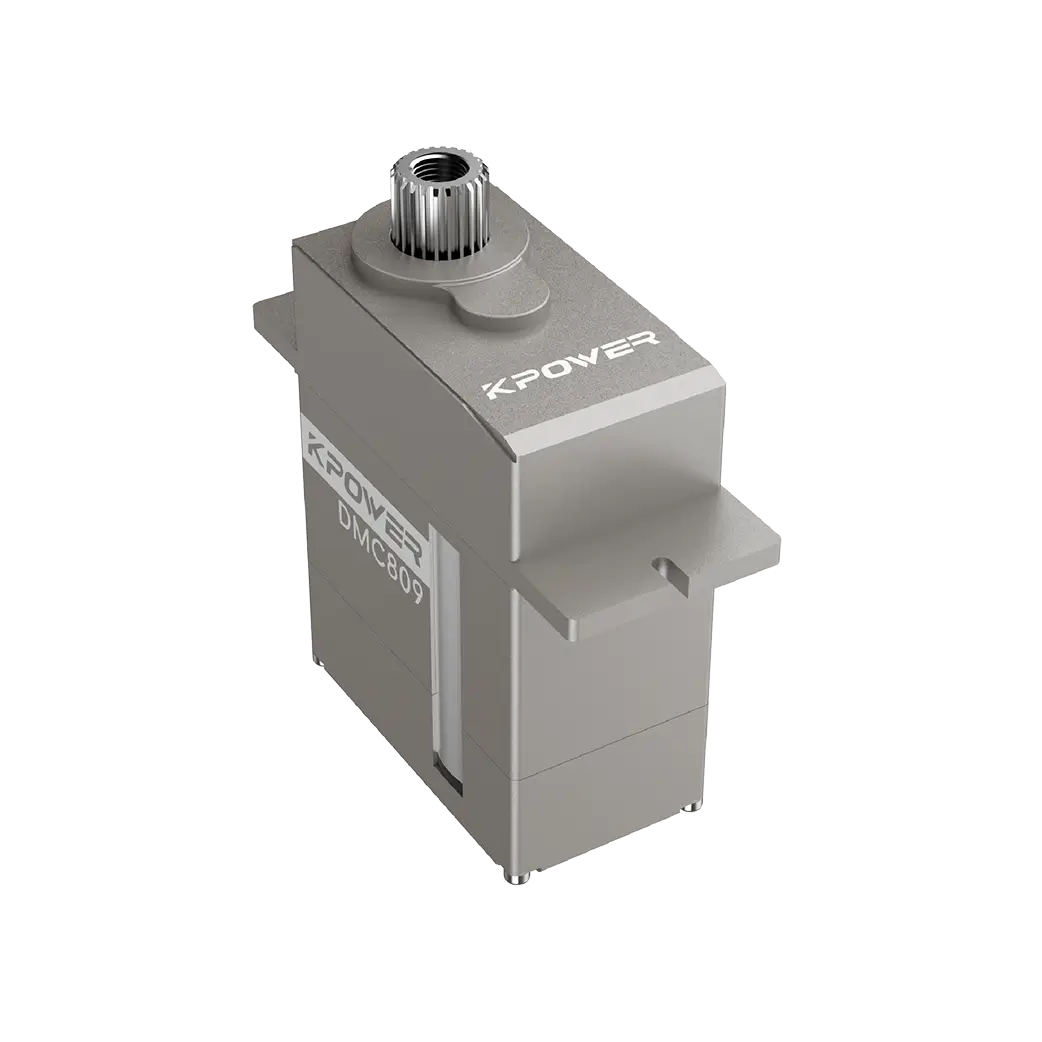
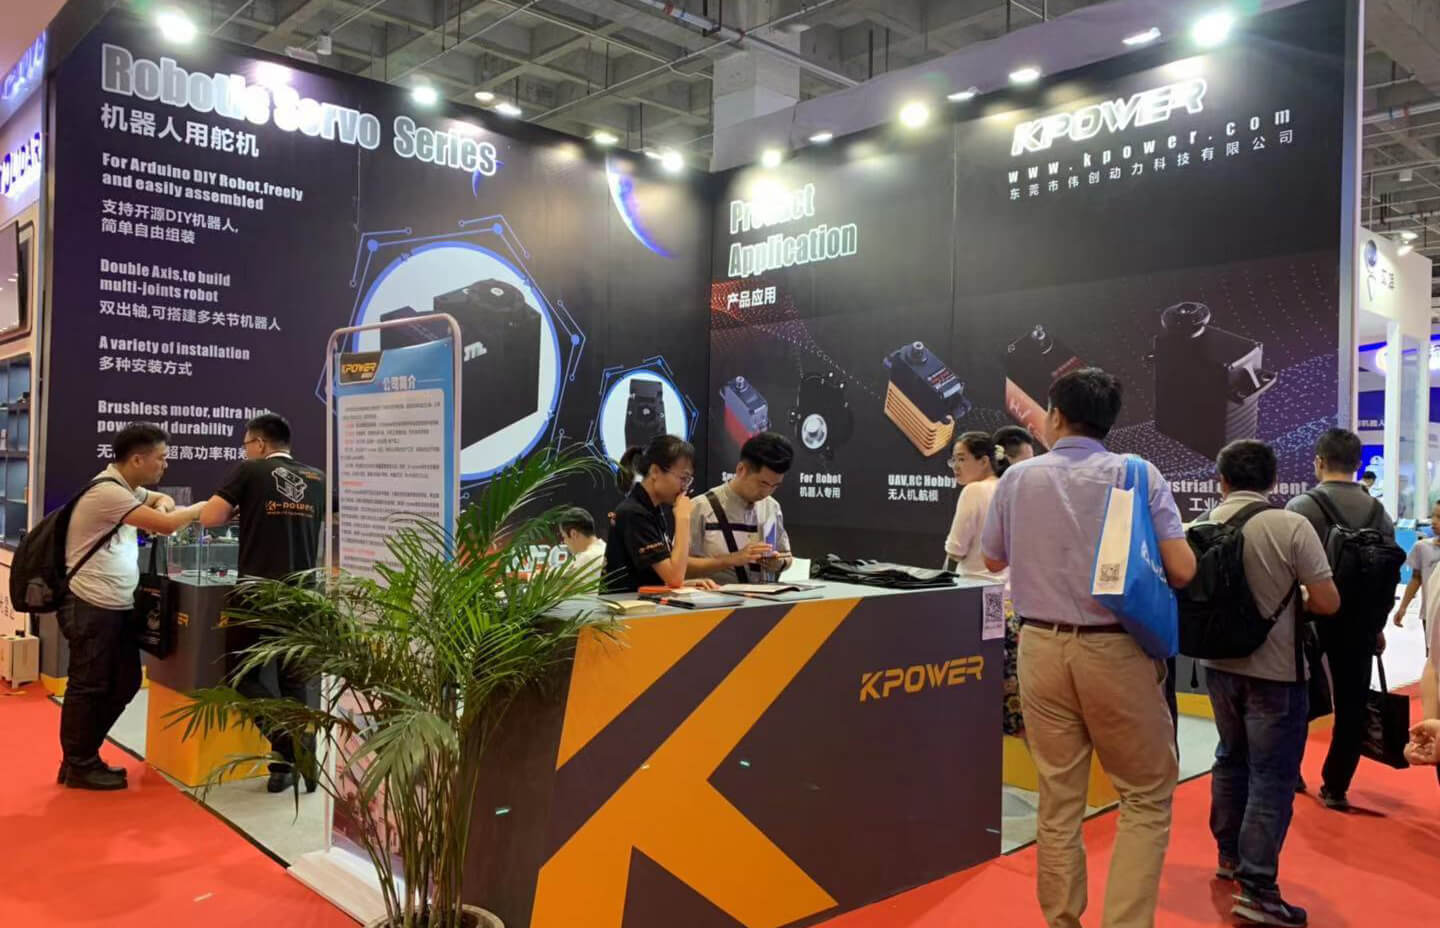
Established in 2005,kpowerhas been dedicated to a professional compact motion unit manufacturer, headquartered in Dongguan, Guangdong Province, China. Leveraging innovations in modular drive technology, Kpower integrates high-performance motors, precision reducers, and multi-protocol control systems to provide efficient and customized smart drive system solutions. Kpower has delivered professional drive system solutions to over 500 enterprise clients globally with products covering various fields such as Smart Home Systems, Automatic Electronics, Robotics, Precision Agriculture, Drones, and Industrial Automation.
Update Time:2026-01-19
Contact Kpower's product specialist to recommend suitable motor or gearbox for your product.