


TECHNICAL SUPPORT


Published 2026-03-27
Friends who are engaged in dual-axisservodevelopment know that the biggest fear is not that the code cannot be written, but that facing a bunch of cables and motors, the control logic in the mind cannot be connected at all. Today we will talk about the "dual-axis steering gear control system flow chart" that gives many people a headache, and help you break down this hard nut.
Have you ever had this kind of experience? The motor can rotate and the sensor can read, but the two axes are stuck when they work together? In fact, the problem often lies in the fact that we do not have a clear map of the entire control process. Without this flowchart, it would be like entering a strange city without navigation. If you take one step at a time, your efficiency will naturally not improve.
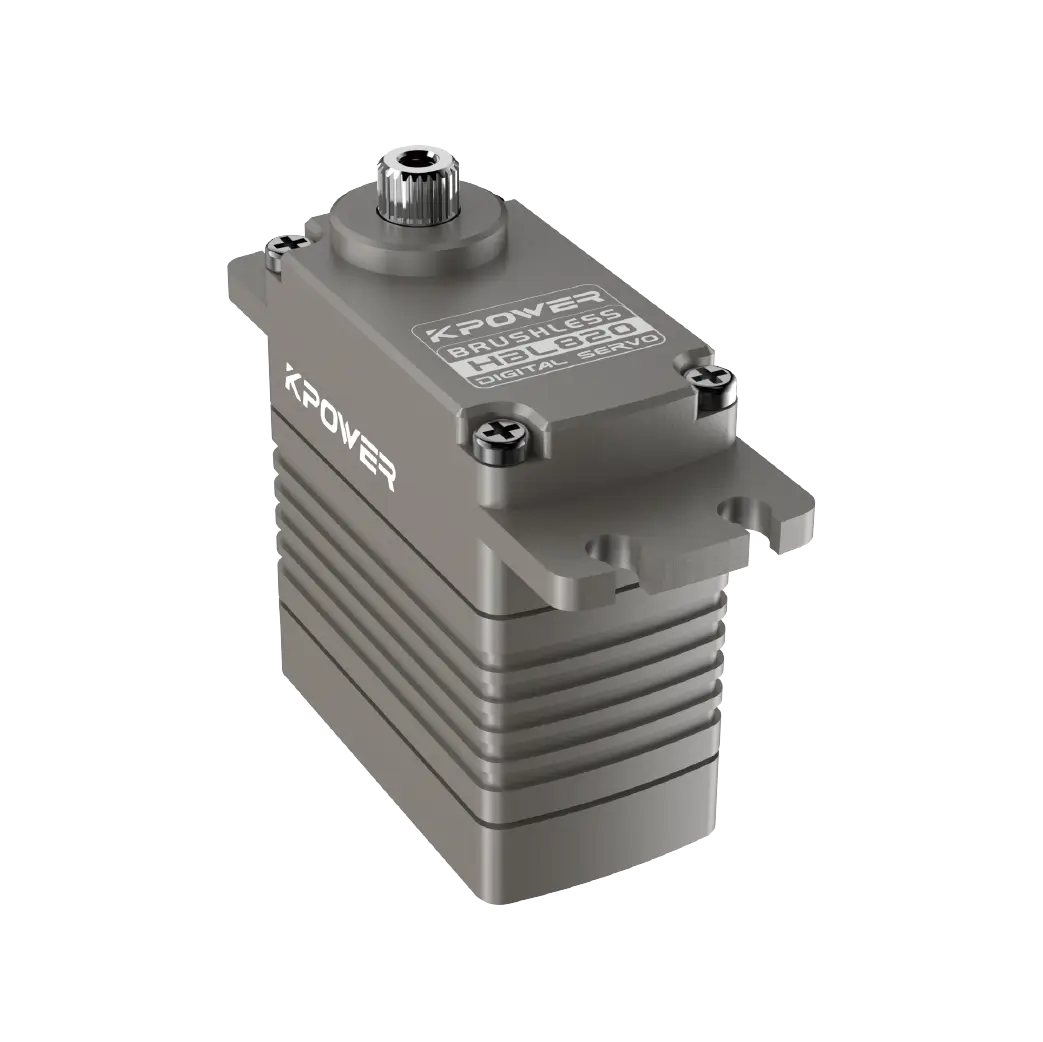
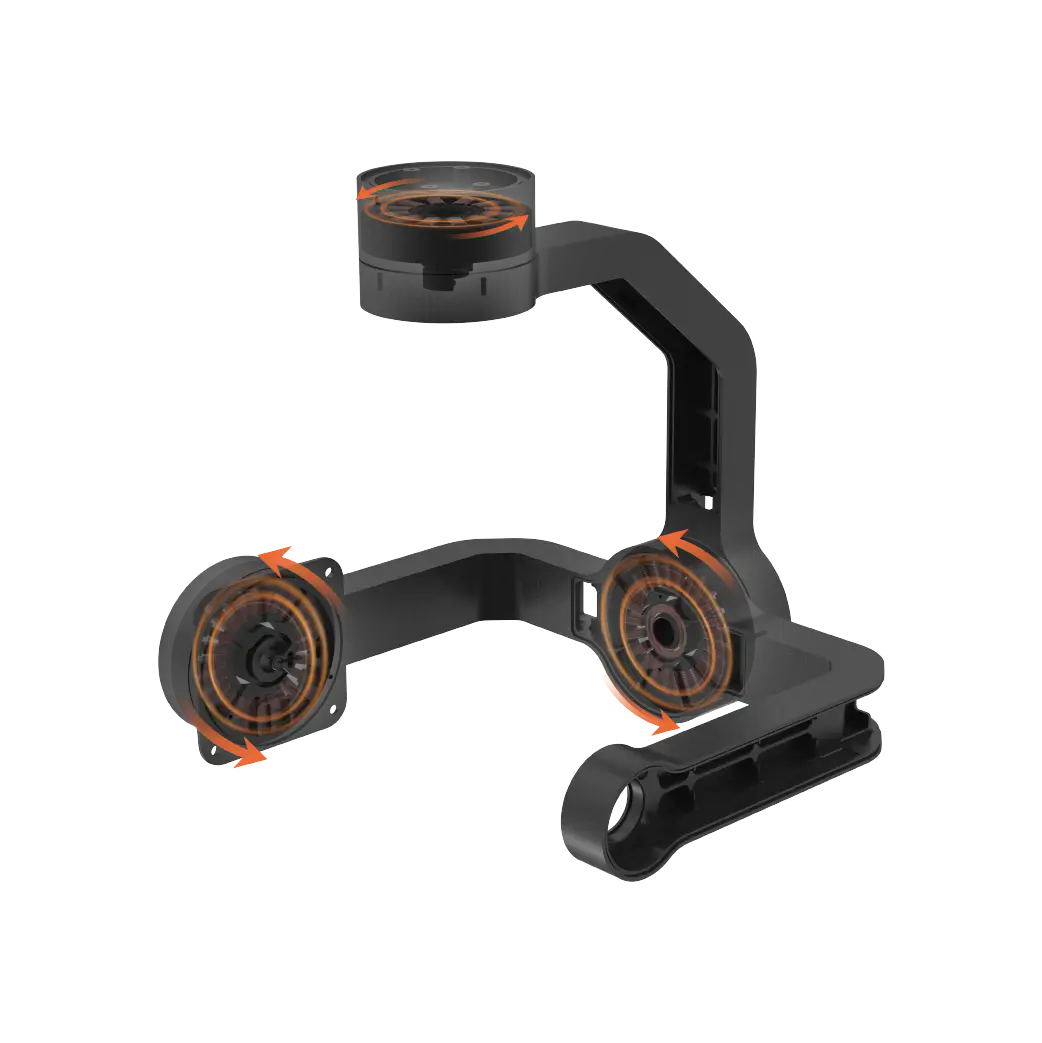
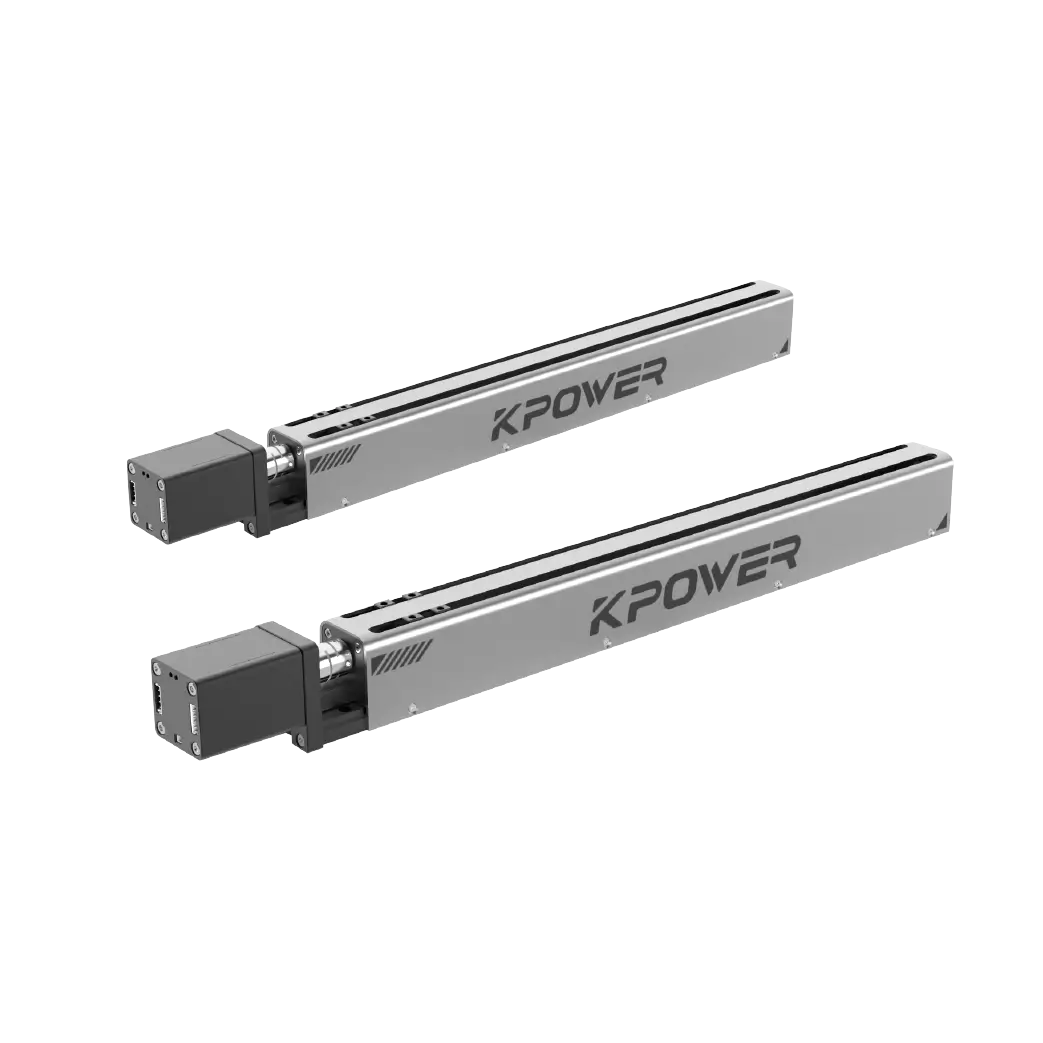
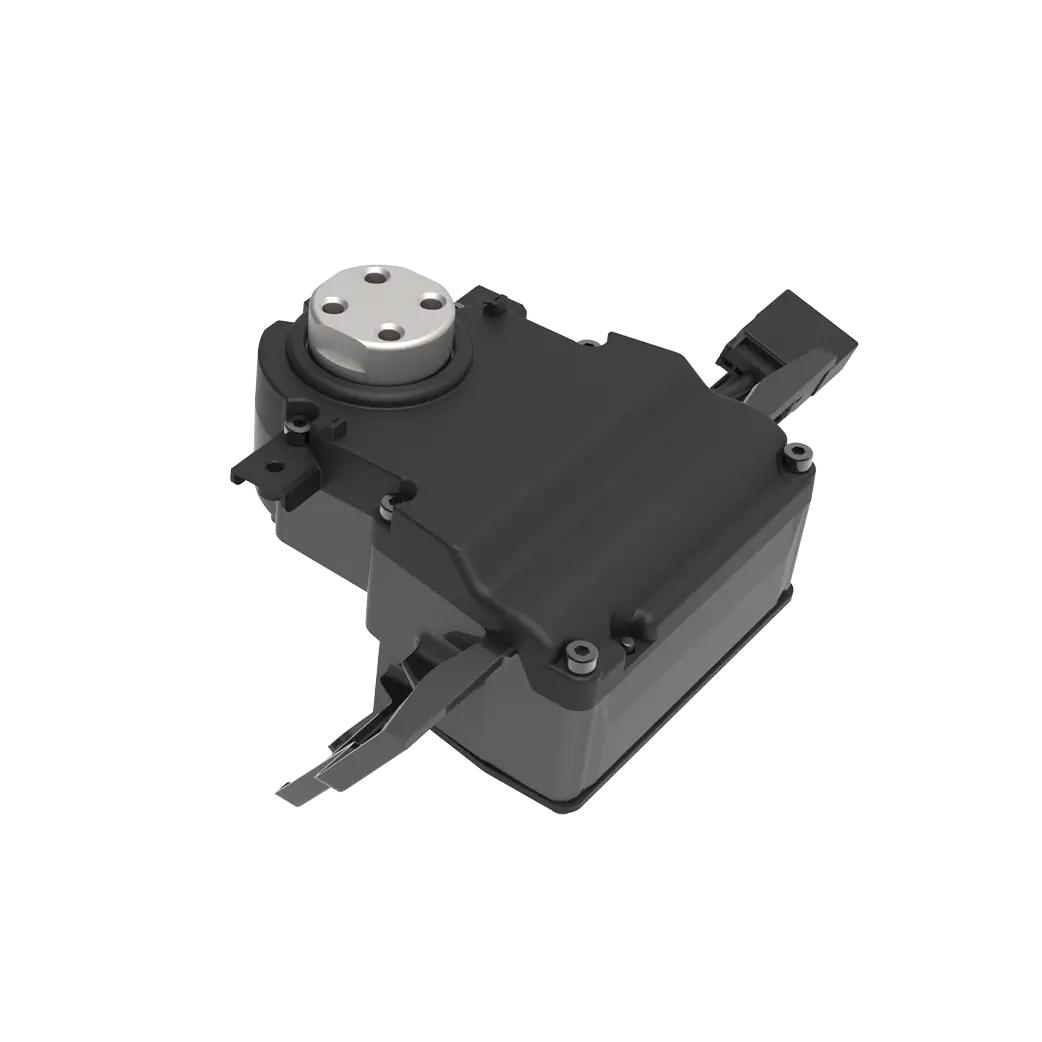
Speaking of dual-axisservos, they actually move in both horizontal and vertical directions at the same time. You can think of it as adding a brain to the gimbal, which requires it to follow the target horizontally and keep aiming vertically. A common mistake that many novices make is to debug the two axes separately. As a result, everything goes wrong once they are linked.
A truly reliable control system must integrate the signals of the two axes into the same set of logic. In other words, your flow chart must clearly indicate how the vertical axis should respond when the horizontal axis receives a certain angle command. It's like a band leader who can't let the drummer and guitarist play their part.
When I get a new project, I usually start with the input signal. The most critical input of a dual-axisservosystem is often the PWM signal from the remote control or the angle value sent from the serial port. When drawing a flow chart, the starting point must be marked clearly with the source of the signal, whether it is peripheral interrupt reading or timer polling.
Some friends always get stuck at the beginning because they don’t understand where the data comes from and in what format. For example, if you use STM32 as the main control, you must clearly mark on the flow chart which IO ports are responsible for receiving signals, and where the exits that fail data verification point to. Once the entrance is clear, the logic behind it will be smooth.
The PID algorithm is the heart of dual-axis control, but many people simply draw a box and write "PID calculation" in their flow charts, which is completely insufficient. A truly effective flow chart will separate the three links of PID and clearly mark when the proportional term is calculated, when the integral is limited, and from which sampling the differential term is taken.
Also, pay attention to the priority between the two axes. For example, do you calculate the vertical axis after the horizontal axis is stabilized, or do you process the two axes in parallel. This sequence directly affects whether the gimbal will "nod" when moving at high speed. Using judgment diamond boxes to mark priority conditions in the flow chart can help you find many hidden bugs in advance.
What are you most afraid of when building a control system? These are emergencies such as motor stalling and sensor disconnection. A good flow chart cannot just draw the normal process, but must open a branch to draw exception handling. For example, you can draw a "fault detection" module next to the main loop, and jump to the shutdown process once the current exceeds the limit.
I have seen many engineers with beautiful flow diagrams, but the servo shook like chaff as soon as the power was turned on. In the end, it was discovered that the limit switch was not reflected in the flow diagram at all. It is recommended that you clearly mark on the diagram where the soft limit and hard limit are to be checked respectively, and if the check fails, whether to directly cut off the power or perform a return to center action.
The flow chart is not something to be thrown into the cabinet to collect dust after you draw it. It should be a navigation chart for you to adjust parameters. For example, when adjusting PID parameters, you can look at the flow chart step by step: which judgment branch will be affected by adjusting the proportional coefficient, and whether it will bias the integration link. In this way, parameter adjustment is purposeful and not a matter of luck.
In addition, using flow charts to troubleshoot problems is particularly efficient. Once I encountered zero-point drift of the servo, I took the flow chart and followed it, and found that the "reading calibration value" link was missing in the initialization part, and it was quickly repaired. Therefore, flow charts are really a life-saving tool for us to engage in embedded development.
After drawing control flow charts for so many years, I think the most practical method is to draw each axis as an independent task, and finally use synchronization lines to connect the intersection points of the two axes. For example, after collecting data on both the horizontal and vertical axes, a "coordinate transformation" module is used to integrate the data from the two axes.
Another little trick is to mark each module in the flow chart with an estimated execution time. For example, "reading" is marked with 5 microseconds, and "PID operation" is marked with 3 microseconds, so that you can see at a glance which link is the bottleneck. Especially for dual-axis systems, if the calculation of the horizontal axis takes too long, the response of the vertical axis will be delayed. It is particularly useful to mark this detail clearly on the diagram.
When you see this, you may ask, I happen to have a dual-axis gimbal project on hand. Can I draw a standard flow chart based on your idea? In fact, the requirements of each project are different, but they remain the same. As long as you grasp the three main lines of signal flow, algorithm logic, and exception handling, your flow chart will not deviate. In your opinion, in actual projects, which link on the flow chart is most likely to cause problems with biaxial coordination? Welcome to chat about your experience in the comment area. If you think today’s content has inspired you, don’t forget to give it a like and support~
Update Time:2026-03-27
Contact Kpower's product specialist to recommend suitable motor or gearbox for your product.


