




TECHNICAL SUPPORT


Published 2026-10-01
Quick Answer
A BLDC motor efficiency map plots efficiency (percentage) across speed and torque in a 2D grid. It shows exactly where your motor wastes energy. Most buyers select by peak power rating and never look at the map. That's how you end up running a unit at 74% efficiency in continuous duty when 92% was available on the same chart. Before finalizing a spec, identify your operating speed-torque window, overlay it on the map, and confirm it sits inside the high-efficiency band (typically 85–95%). If it doesn't, you're paying for heat and kilowatt-hours you never needed.
Introduction
Your BLDC motor is burning more watts than it should. Not because it's defective — because it's running outside its efficient window and nobody checked the map before ordering. Efficiency maps expose the gap between rated specs and real-world performance. That gap hits your energy bill, thermal load, and component lifespan directly. Reading the chart properly is the difference between a motor that runs quietly for five years and one that fights you every shift.
What an Efficiency Map Actually Shows
Think of it as a topographic chart of energy loss.
The X-axis ismotor speedin RPM. The Y-axis is torque in newton-metres or percentage of rated torque. Colour-coded or numbered contour lines mark efficiency at every speed-torque intersection. The "sweet spot" — the maximum efficiency point — is where copper, iron, and friction losses balance. Outside that zone, efficiency drops fast. A motor rated at 94% peak may sit at 78% at 1,200 RPM with only 30% torque load. That 16-point gap is where your wasted energy lives. Most datasheets tuck this chart on page four. Most buyers never open page four.
How to Read the Axes and Contour Lines
Start at your operating point — continuous duty, not peak. Mark it on the chart. Then trace the contour line passing through that point.
If you land on the 88% line, you're fine. If you land on the 74% line, the motor is oversized or mismatched for your duty cycle. Run this quick self-check:
Does your continuous load sit inside the 85%+ contour?
What's the efficiency at your minimum load condition?
How much does efficiency drop between 25% and 100% load at your operating speed?
Those three answers tell you whether the motor is right-sized or just right on paper.servomotor selectionwithout this step is guesswork dressed up as engineering.
Key Specifications to Check Before You Buy
When a BLDC Motor Is the Right Choice
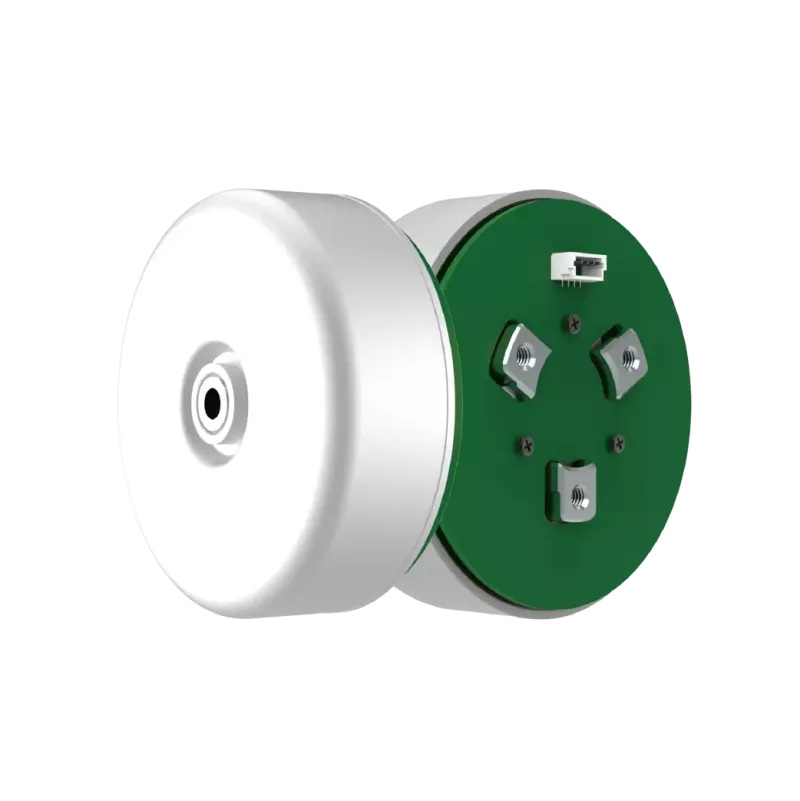
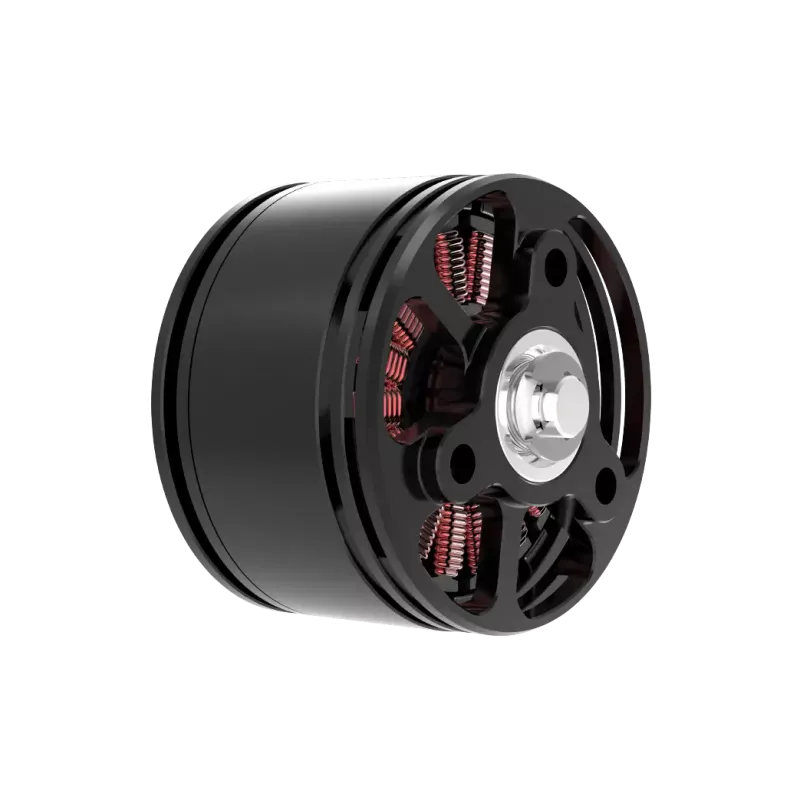
ABLDC motorfits applications demanding wide speed range, high power density, and predictable thermal behavior — industrial drives, robotics, andmotion control applicationswhere efficiency directly translates to energy cost or battery life. It's the wrong choice if your load is very low-power, the speed range is narrow, or your team lacks the inverter and control infrastructure. A BLDC without a well-matched drive is just a more expensive problem. Confirm your controller supports the commutation method and that your loop bandwidth matches yourtorque requirements .
Common Questions Before Ordering
Q: What efficiency should I expect from a typical industrial BLDC motor?
A: Between 85% and 96% at the designed operating point, depending on size, winding material, and load. Verify the exact number on the efficiency map for your specific RPM-torque pair rather than trusting a single peak figure.
Q: Where do I find the efficiency map for a given motor?
A: Typically on page 3–5 of the supplier datasheet or as a downloadable PDF from the manufacturer's product page. If it's not in the spec sheet you received, request it directly. A supplier that can't produce one raises questions about anycustomservosolutionsthey offer.
Q: Does a higher peak efficiency rating always mean a better motor for my application?
A: No. A motor with 96% peak at one point may sit at 79% at your actual operating speed-torque pair. Always match the map to your duty profile, not the headline number.
Q: How does running outside the high-efficiency band affect maintenance costs?
A: It increases winding temperature by 10–25°C in many cases, accelerating insulation degradation and cutting bearing life. The upfront savings on a smaller, cheaper motor often vanish within two replacement cycles.
Choosing the Right Motor for Your Application
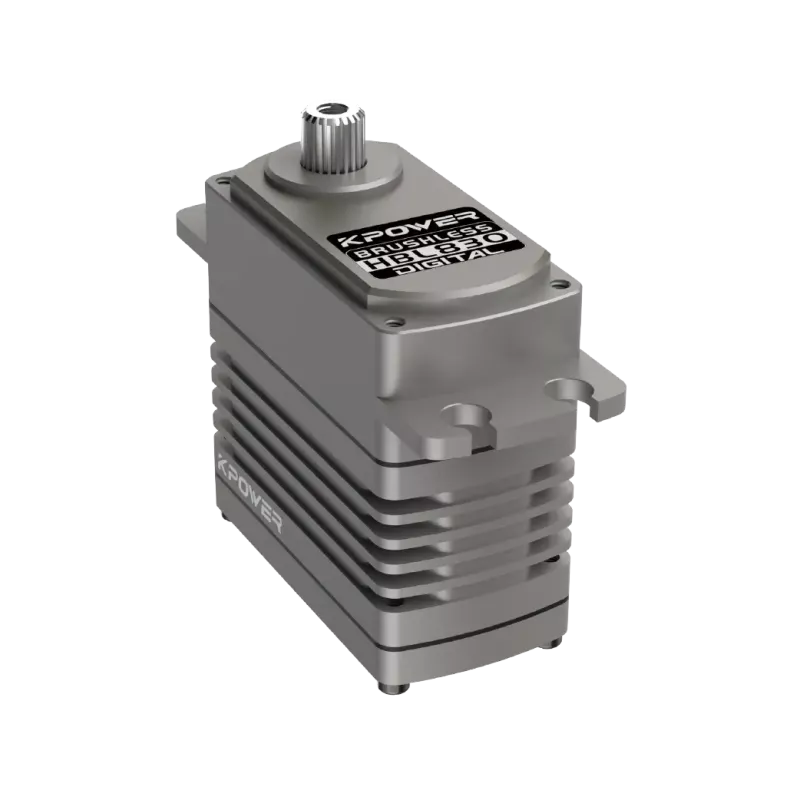
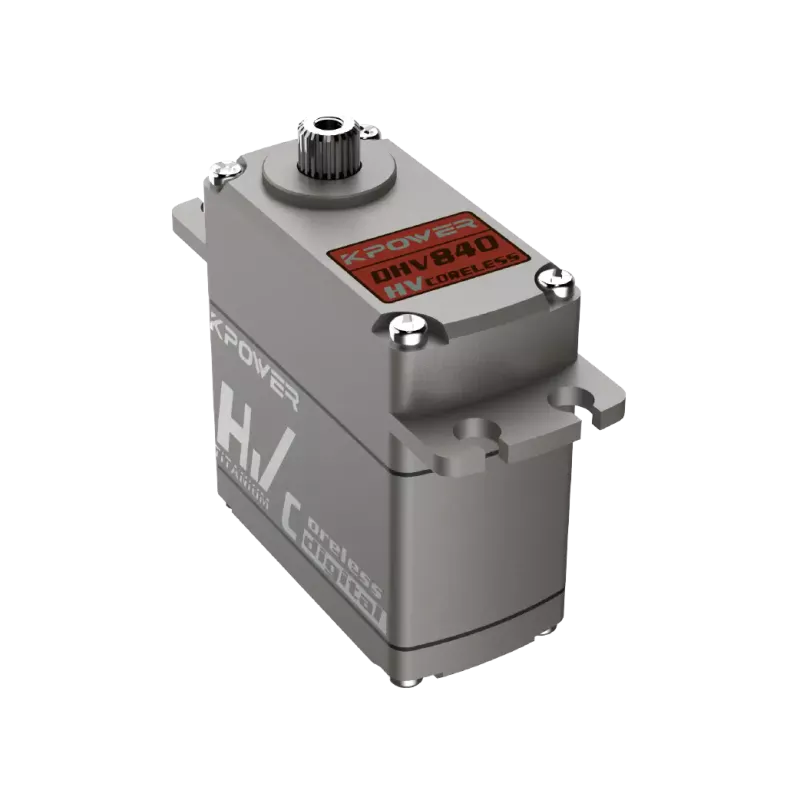
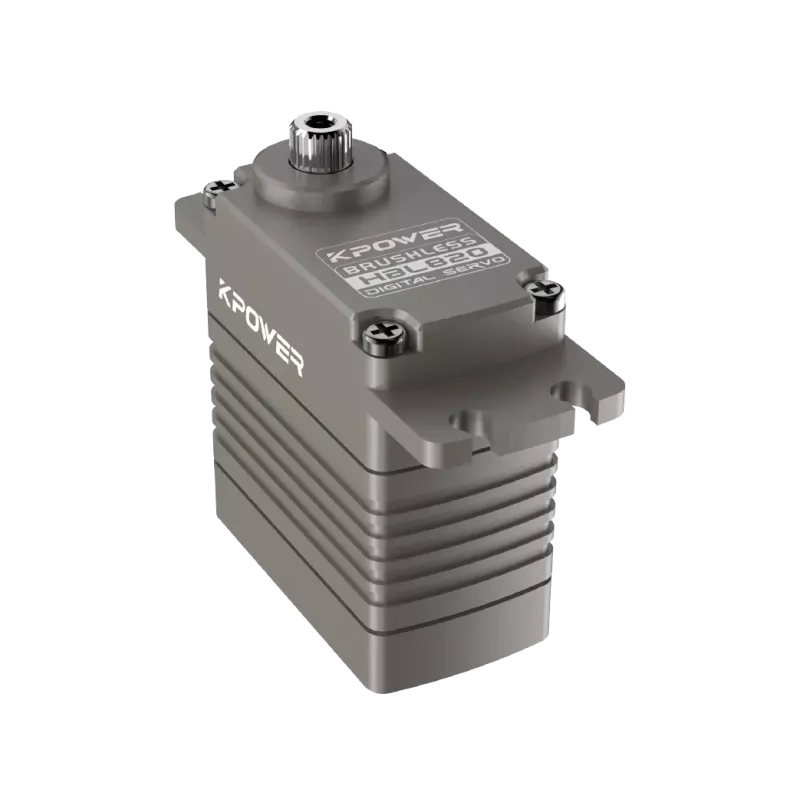
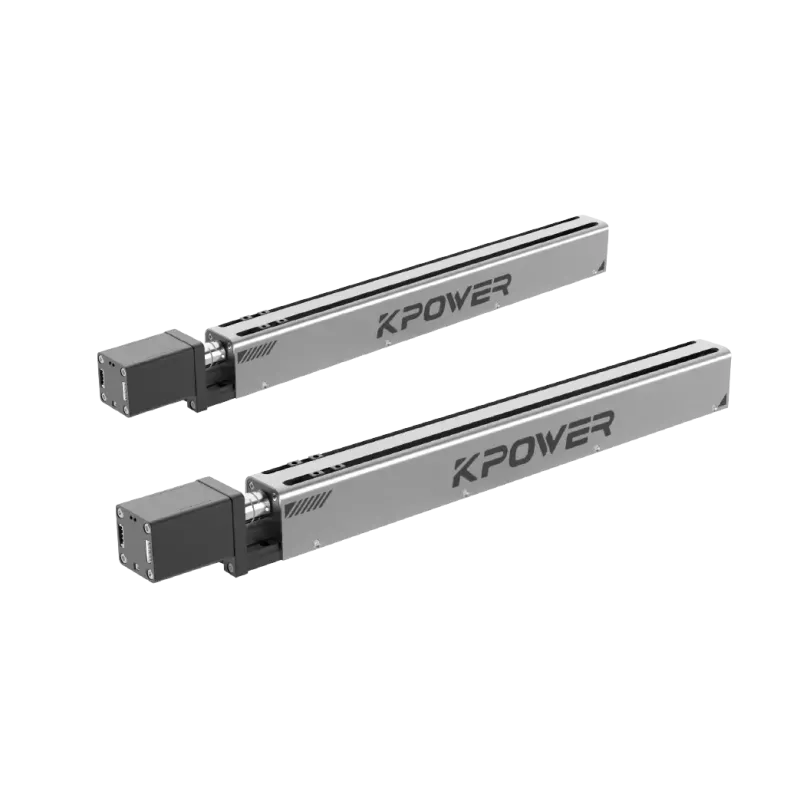
Picking the rightkpower servoor BLDC unit isn't about the highest number on a spec sheet. It's about matching the efficiency contour to your real operating window, verifying thermal margins, and confirming your drive controller can extract that performance. Send us your speed-torque profile and duty cycle. We'll overlay it on the candidate motor's efficiency map and flag any red zones before you commit. That one step saves energy, heat, and a premature replacement.
Update Time:2026-10-01

Contact Kpower's product specialist to recommend suitable motor or gearbox for your product.


